A study recently published by NERC pours cold water on the idea that utilities can safely leave some distributed energy resources (DER) out of their interconnection studies without affecting the accuracy of their models.
The DER Modeling Study: Investigating Modeling Thresholds, released last month, was intended to respond to industry stakeholders’ comments on various documents on DER modeling produced by NERC’s System Planning Impacts from Distributed Energy Resources Working Group (SPIDERWG). While the group has consistently argued for a threshold of 0 MVA for gathering data to populate system models, some industry participants have pushed for non-zero thresholds to reduce the resources needed for data collection.
NERC defines DER as “any source of electric power located on the distribution system” — facilities located behind a transmission-distribution transformer that serve end-use customers, such as rooftop solar panels and energy storage in homes and businesses.
Because they sit behind the meter, DER have traditionally been viewed as a part of the distribution system only, with little or no impact on the broader bulk power system, SPIDERWG has previously noted. (See NERC’s SPIDER Group Warns of Modeling Difficulties for DERs.)
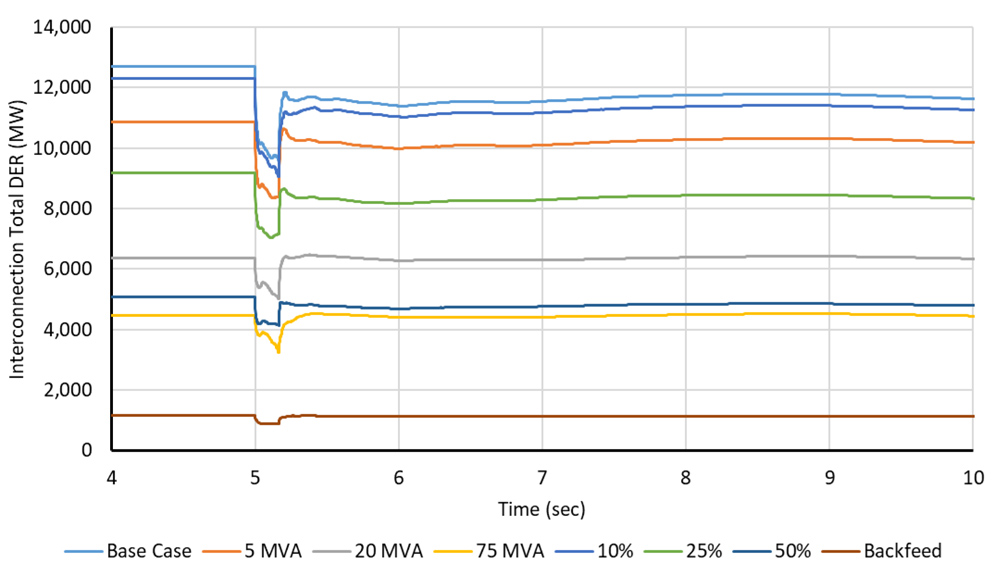 Total DER output during delayed clearing bus fault | NERC
But with the number of DER on the distribution system growing rapidly and potentially affecting customers’ energy usage patterns, the group said in November that transmission planners and planning coordinators can no longer ignore their impacts. (See NERC’s DER Strategy Focuses on Industry Education, Collaboration.)
The study used a base case provided by WECC, modified to simulate the effects of not modeling various amounts of DER depending on their size. NERC believed this approach would simulate the effect of using thresholds other than 0 in modeling data. The team chose a scenario representing a heavy load condition for spring 2023, which assumed 8.41% of load served by DER — the highest level in the Western Interconnection of all base cases considered.
NERC set thresholds for the study using various measures. Aside from the base case, which includes all 12.7 GW of DER that would normally be accounted for in the model, seven cases were considered:
- The same as the base case but ignoring generators with a rating of less than 75 MVA under NERC’s DER_A model developed by SPIDERWG;
- Similar to the above, with a threshold of 20 MVA;
- Threshold of 5 MVA;
- Similar to the above cases, but DER are ignored when they account for 10% or less of the “load record” (an aggregate representation of end-use load in the base case); DER modeling adds an offset or a separate generator record to the load record to represent DER generation;
- Similar to previous, but with a 25% threshold;
- 50% threshold; and
- Same as the base case, but only including DER that backfeed energy into the bulk electric system.
The study simulated the loss of two large conventional generation facilities, along with the loss of the major HVDC intertie between California and the Pacific Northwest to determine the impact on frequency stability. Report authors also used a transmission fault simulation to study the dynamic response of the system under a variety of conditions.
Results showed notable differences in behavior when the simulated faults were applied. In the cases other than the 10%, excluding DER led to an increase or decrease in the frequency nadir for the system under the resource loss scenarios. NERC noted that the 10% threshold performed most like the base case, perhaps because this change reduced the level of DER the least, with only 390 MW of generation excluded from the model. This left almost 97% of DER still modeled.
The team called this finding “a testament to having proper data collection and data verification procedures in place,” saying accurate study results can still be achieved, even if some generation data is excluded, because “the data verification can fine tune capacity and control parameters to ensure accurate study results over time.”
However, NERC concluded that changing the modeling threshold beyond the 10% case “did have a significant difference in simulated system level performance,” which contradicted stakeholders’ suggestion that they could plan the system safely with different thresholds. Authors recommended that grid planners gather the total DER capacity for their footprints, though they allowed that different modeling thresholds could be set if appropriate for local systems.
The report also called for future studies to “target different aspects of simulated DER output” that did not fall in this study’s purpose. Such studies could include investigations of the effect of modeling lower thresholds of DER, or using different assumptions for the faults studied.