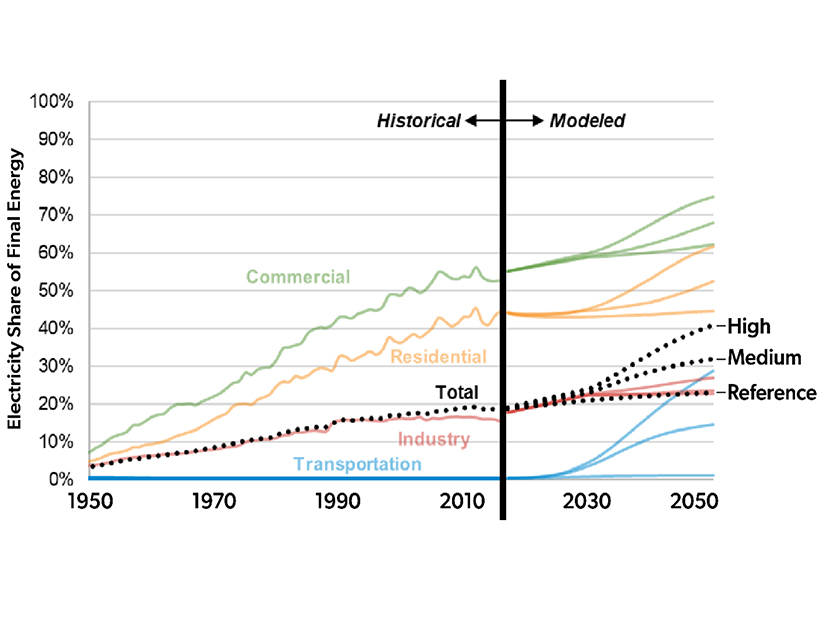
New sources of demand growth such as data centers for artificial intelligence and rising industries are complicating electricity load forecasting, according to a new report released by The Brattle Group on May 8.
Electricity Demand Growth and Forecasting in a Time of Change provides an overview of several new demand drivers that will affect load growth and patterns in the coming decades and how utilities include them in their forecasts.
“Currently, there is a wide spectrum among utilities in how they account for these new drivers,” T. Bruce Tsuchida, a Brattle principal and co-author of the report, said in a statement. “The future net load growth spurred by the new drivers is vast, and our analyses suggest that — given this growth, along with the change in load characteristics and other associated uncertainties — the industry will require a revamped approach to load forecasting moving forward.”
NERC recently raised its compound annual growth rate (CAGR) for load from 0.6% per year to 1.1% per year over the next 10 years, which is higher than at any point in the past decade. FERC Form 714 filings from utilities have shown peak demand growth rates increasing from 2.6% in 2022 to 4.7% in last year’s filings, Brattle’s report said.
The new demand drivers and their changing nature and flexibility warrant looking at load forecasting from a different perspective, it said.
“In today’s world, where much of these new demand drivers are policy-driven, the risk of under- versus over-forecasting is asymmetric,” the report said. “With a climate strategy that relies heavily on clean electrification, the cost and long-lasting effects of underforecasting may be much larger than those of overforecasting — while still recognizing that large overforecasts also have accompanying costs.”
Policies aimed at combating global warming are driving some of the new demand, but in some regions, new data centers are having a major impact on load growth. Data centers use about 19 GW of capacity now, but with a 9% CAGR, the sector is expected to add the equivalent of New York City’s demand over the next five years nationally.
“The number of data centers is growing rapidly to meet increasing data usage from streaming services, social media, mobile devices and cloud computing, just to name a few,” the report said. “The emerging fields of AI and machine learning require massive computational power and storage, fueling demand for data center infrastructure and, with it, the demand for electricity. These loads tend to run constantly.”
Cryptocurrency mining uses an estimated 10 GW to 17 GW across the country, and its growth is volatile and based on crypto prices, but it could grow by an additional 8 GW to 15 GW by 2030.
Type A vs. Type B
However, the biggest potential source for growth this decade, Brattle reports, is hydrogen production, which could increase from just 70 MW to 25 GW of demand by 2030, which works out to 132% growth yearly.
The load growth drivers can be classified in two basic ways: “Type A” loads that are large and discrete and often characterized by more uncertainty, and “Type B” loads that are comparatively smaller with smoother growth patterns.
Load growth from electrifying transportation and buildings counts as Type B, but the industry still faces significant uncertainty around its long-term trajectory.
“Load growth from electrification, which naturally requires replacing existing stocks, takes time to materialize and is usually geographically uneven,” the report said. “This contributes to higher levels of uncertainty in these forecasts.”
Data centers, new industry, indoor agriculture and cryptocurrency mining are Type A. “These loads are often quite large and lumpy (sometimes as large as an entire city),” the report said. Their expansion is also concentrated in specific areas and their development can move faster than utility or ISO/RTO planning processes.
The new loads can change suddenly due to shifts in the market or policy and in some cases — such as with cryptomining and indoor agriculture — they can disappear without notice.
“Some of these loads may be able to provide flexibility, so the conventional assumption that planning requires building enough capacity to serve an inflexible peak load may no longer be true,” the report said.
Even without local flexibility, efficiency, demand response and distributed energy resources can offset potential load or sales growth. Those demand-side resources can be large and cost effective for freeing up supply increments for high-priority uses.
Brattle collected load forecasting documents from utilities and ISO/RTOs around the country for the report and found a spectrum of ways entities are dealing with the new drivers of demand. Traditional load forecasting methods assumed that new demand would be inelastic and that future needs could be addressed within a long planning horizon, usually measured in years.
“One of the first steps planners could take today is to comprehensively assess the various drivers, even if a sophisticated modeling approach is not yet available,” the report said. “The latter should come next after the new load types are better understood.”


