The Department of Energy issued three reports on wind-generated electricity, projecting strong but not uniform growth for the nation’s onshore, offshore and distributed wind power sectors.
The Department of Energy on Thursday issued three reports on wind-generated electricity, projecting strong but not uniform growth for the nation’s onshore, offshore and distributed wind power sectors.
Wind was second only to solar in new generating capacity installed in the U.S. in 2022, DOE said in a news release, attracting $12 billion in capital investment and employing more than 125,000 Americans.
The flurry of policy changes made and financial incentives offered during the first two years of the Biden administration have significantly boosted near-term forecasts for future deployment of environmentally friendly wind power, DOE added.
This trend serves another purpose beyond climate protection — economic stimulus. DOE noted at least 11 announcements of opening or expansion of U.S. manufacturing facilities to serve the onshore wind industry.
The reports also touched on significant challenges facing the industry, primarily due to high costs, short supplies and constrained transmission.
The problems are such that the first generation of offshore wind development could be stunted for the next few years, the authors write.
Onshore
The 2023 edition of the Land-Based Wind Market Report was prepared by DOE’s Lawrence Berkeley National Laboratory.
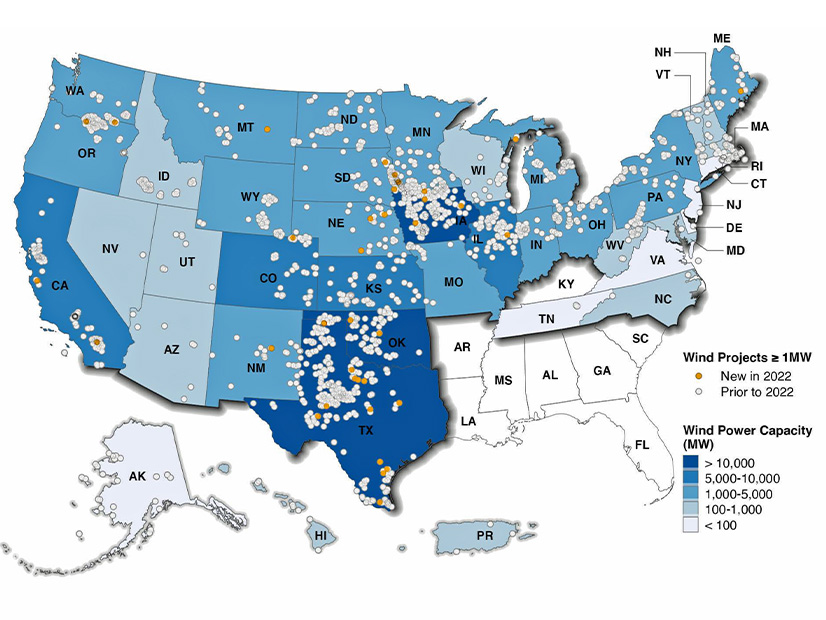
It found that 8,511 MW of new utility-scale onshore wind generation capacity was added nationwide in 2022.
That was the smallest increase since 2018, due to a confluence of factors that included inflation, supply-chain constraints, rising interest rates, interconnection delays, siting challenges and — until passage of the Inflation Reduction Act last August — a reduction in the value of the Production Tax Credit.
Other key takeaways from the report include:
The U.S. is second only to China in wind power generation, but wind provides only 10% of the electricity generated in the U.S., far less than wind power leader Denmark (57%).
Iowa is the state wind power leader, deriving 60% of its power from wind.
New utility-scale turbines were installed in 14 states in 2022, with Texas accounting for nearly half the capacity, at 4,028 MW.
For the first time, corporations and other nonutility buyers bought more wind-generated electricity than utilities did in 2022; direct retail purchase of wind power accounted for at least 44% of the new capacity added last year.
The average nameplate capacity of newly installed onshore turbines was 3.2 MW in 2022, up 7% from 2021; the average hub height was 98.1 meters above ground, a 4% increase.
Wind power as a percentage of system load ranged from 37.9% in SPP to 3.1% in NYISO.
Offshore
The 2023 edition of the Offshore Wind Market Report was prepared by DOE’s National Renewable Energy Laboratory.
It found that the U.S. offshore wind pipeline reached 52,687 MW in 2022, up 15% over 2021. This breaks down to 40 projects in some stage of development totaling 47,606 MW, and 5,039 MW of potential capacity in planning stages. (The two U.S. projects already in operation have a combined 42 MW capacity.)
Other key takeaways from the report include:
The U.S. offshore wind industry invested $2.7 billion in ports, vessels, the supply chain and transmission capacity.
Offshore wind lease areas continued to grow in number and variety, as a late 2022 auction offered the first Pacific Coast leases and the first that will require floating wind turbine technology.
The policy and statutory goals of 13 states have reached 112,286 MW of nameplate capacity.
Many U.S. offshore wind projects are facing headwinds from supply chain constraints, inflation and interest rate hikes, particularly those with an expected commercial operation date in 2025 or 2026; project costs increased 11% to 30% in 2022.
Key indicators in the U.S. offshore wind energy market point toward sustained market growth, but macroeconomic hurdles could significantly stunt that growth for the first generation of commercial projects; incentives provided by the IRA may provide some relief.
Distributed
The 2023 edition of the Distributed Wind Market Report was prepared by DOE’s Pacific Northwest National Laboratory.
It tallied 1,755 distributed wind turbines added in 13 states in 2022. Those 1,755 turbines had a combined capacity of 29.5 MW and required a total investment of $84 million.
Other key takeaways from the report include:
Cumulative distributed wind capacity has reached 1,104 MW from more than 90,000 turbines in all 50 states, the District of Columbia, Guam, Puerto Rico and the U.S. Virgin Islands.
California, Iowa and Nebraska had the most capacity additions last year, due in part to projects that entail large-scale turbines — those greater than 1 MW in size.
Minnesota led the nation again in smaller-scale capacity additions — turbines rated at 100 kW or less — due primarily to the continued push there to sell small-scale wind power to agricultural markets.
None of the distributed wind projects reported in 2022 used midsize turbines — those rated at 101 kW to 1 MW.
Iowa by a wide margin has the greatest installed distributed capacity, at 222 MW; runners up are Minnesota (128 MW) and California (83 MW).
Agriculture is the most common use for distributed wind installed in 2022, accounting for 33% of projects; residential and commercial were second, tied at 26%.
Only 10% of distributed wind projects completed in 2022 were interconnected to the grid; the great majority were intended to provide energy for on-site use.


