Utility-scale solar construction reached record levels across the United States in 2023 and its cost continued to decline, the Berkeley Lab announced in this year’s edition of its annual report on the sector.
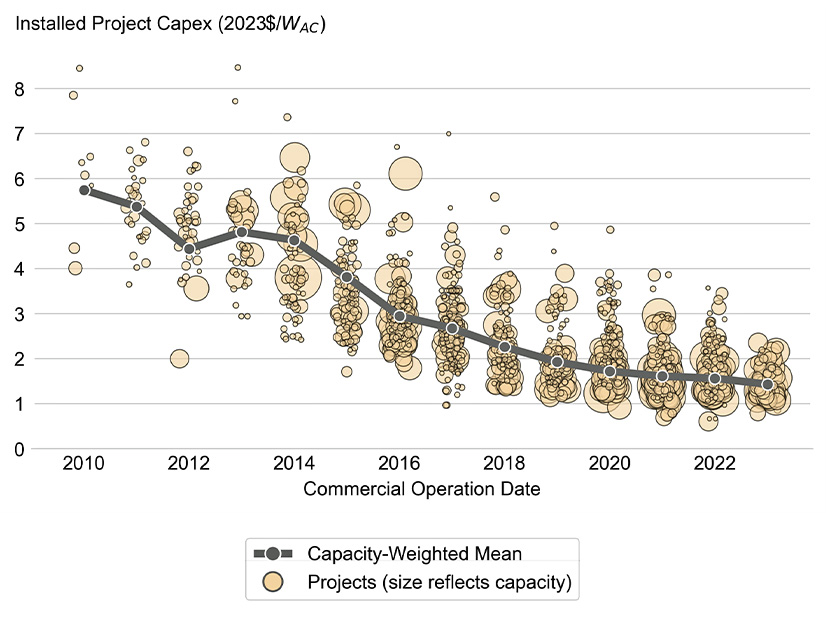
A total of 18.5 GWAC of large-scale solar was brought online last year, bringing total installed capacity to 80.2 GWAC in 47 states, the report says, while capacity-weighted average installed costs decreased 8% to $1.43 per watt AC.
The levelized cost of electricity from these utility-scale photovoltaic systems rose slightly to $46/MWh, not counting tax credits, but decreased slightly to $31/MWh once the federal incentives were factored in.
For the first time ever, more than half of new grid capacity nationwide was solar — 17% distributed and 35% utility-scale.
The report predicts that 2024 will be another record year, with more than 35 GW of utility-scale solar and distributed commercial or residential solar installed.
A whopping 1.09 TW of utility-scale solar is stacked up in the nation’s interconnection queues, but historically, only 10% of requests ever advance to construction, the Lawrence Berkeley National Laboratory noted as it announced the new report Oct. 15.
The 2023 report and its executive summary drill down on the state of the utility-scale solar sector. Among the details, data points and conclusions:
-
- Only 4% of utility-scale PV capacity added in 2023 was installed on a fixed-tilt mount; the rest used single-axis tracking. Fixed-tilt is relegated mainly to challenging sites and least sunny regions of the Northeast; tracking mounts add 20 cents per watt to the cost on average but can boost capacity significantly in sunny regions.
-
- Projects larger than 50 MW cost 13% less per megawatt on average than their counterparts rated at 5 MW to 50 MW.
-
- Plant output still declines with age, but more recent projects are showing a slower decline than earlier projects did at the same points in their lifespans.
-
- Solar power purchase agreements have largely closed the gap with onshore wind PPAs — both were much more expensive 15 years ago, but solar PPA prices have declined more sharply than wind. Lower natural gas prices, meanwhile, have given existing combined-cycle gas-fired generators a near-term cost advantage over solar.
-
- Concentrating solar thermal power has been lagging, with no U.S. installations since 2015. The newest of the existing installations have underperformed expectations.