By Michael Kuser
NYISO third-quarter energy prices fell 16 to 30% compared with the same period a year ago because of mild summer conditions, lower natural gas prices and higher output from nuclear and hydropower plants, the ISO’s Market Monitoring Unit reported last week.
Reduced congestion into Long Island and increased congestion out of NYISO’s North Zone contributed to the decline, as well as to “substantially lower” ancillary service prices and uplift costs, MMU Director Pallas LeeVanSchaick, of Potomac Economics, told the ISO’s Market Issues Working Group on Nov. 29.

While the Q3 report showed that NYISO’s market was competitive and that most prices and costs were down substantially compared with last year, the Monitor continued to identify potential improvements to market performance.
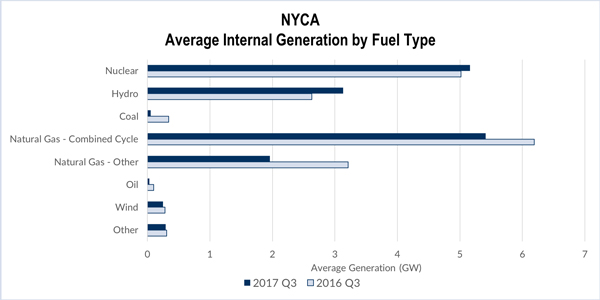
The report noted that a mild summer helped reduce loads by 1.8 GW on average, while natural gas prices in most of eastern New York and New England fell 12 to 19%. Nuclear and hydro units increased their average output by up to 640 MW.
Day-ahead congestion revenue fell 20% to $104 million partly because of the lower loads. West Zone lines accounted for the largest share of the congestion (25%) during the quarter, as imports from Ontario and hydro output met with bottlenecks while flowing east. New York City lines accounted for 20%, increasing because of higher gas prices relative to other regions and the expiration of the Con Ed-PSEG wheel. Long Island’s share was down sharply to 17% because of fewer major transmission outages.
Flows from the North Zone accounted for 21% of congestion, as transmission outages and derates and hydroelectric output increased, leading to several extreme negative pricing events.

Actions used to manage 115-kV congestion in western and northern New York led to import limitations from Ontario and Quebec, as well as congestion on the higher-voltage system in other parts of the state. The MMU said the costs and reliability effects of this congestion could be reduced by modeling the 115-kV constraints in the day-ahead and real-time markets.
Capacity Market Spot Prices Down
Third-quarter spot prices for capacity ranged from $2.21/kW-month in Rest of State (ROS) to $9.97/kW-month in New York City. Average spot prices were down 18% in the city and 41% in ROS, but up 6% in the G-J Locality and 51% on Long Island. Demand curve revisions reflecting changes to assumptions about the unit net cost of new entry were a primary driver for the increased prices.
While an increase in installed capacity (ICAP) was a dominant factor in the ROS price rise, supply was up only modestly from a year ago, reflecting higher test values for dependable maximum net capability, the revival of the Greenridge 4 coal unit and new wind capacity upstate. Cleared import capacity rose 350 MW from a year ago, primarily from PJM. Import capacity from Ontario increased by an average of 105 MW, offset by a similar reduction from New England.
Reserve margin and locational capacity requirements rose in all regions as a result of a recent study by the New York State Reliability Council. However, peak load forecasts fell across all regions, neutralizing the price impact from higher installed reserve margins and locational requirements.
Sharp Fall in Reserve Prices
The report also showed that day-ahead reserve prices fell by 28 to 44% from a year ago, consistent with lower load levels and lower locational-based marginal prices and primarily attributable to a decrease in reserve offer prices. After reserve market design changes in November 2015, the MMU observed offers above the standard competitive benchmark (i.e., estimated marginal cost), which it said is partly attributable to the difficulty in accurately estimating the marginal cost of providing operating reserves. However, day-ahead reserve offer prices have gradually fallen as suppliers gain more experience.

In the third quarter, a large number of units offering reserve capacity — particularly fast-start resources in eastern New York — further reduced their offer prices. The MMU said it continues to monitor day-ahead reserve offer patterns and consider potential rule changes, including whether to modify the existing $5/MWh “safe harbor” for reserve offers in the ISO’s market power mitigation measures.
Congestion Management and Pricing
The MMU noted that the ISO’s market-to-market phase angle regulator (PAR) coordination process expanded in May after the expiration of the 1,000-MW Con Ed-PSEG Wheel. (See NYISO Members OK End to ConEd-PSEG Wheel.) Congestion increased through Millwood and into New York City. In general, transmission lines in the A/B/C and J/K zones were operated more efficiently. However, the MMU observed that PARs in those areas were often not utilized to help manage congestion, being adjusted only one to five times per day on average.
The Monitor found that NYISO improved its transmission shortage pricing in June by modifying the second step of the graduated transmission demand curve (GTDC) from $2,350/MW to $1,175/MW, removing the feasibility screen and applying the GTDC to all constraints with a non-zero constraint reliability margin. As a result, constraint relaxation has been much less frequent, with violations occurring in 6% of interval during the third quarter, compared with 59% last year.
Average constraint shadow prices during transmission shortages fell moderately in most areas. Constraint relaxation leads to inefficient prices that are volatile and uncorrelated with the severity of congestion, the MMU said. Despite improved pricing outcomes, constraint shadow prices still did not properly reflect the importance of some transmission shortages. Accordingly, the MMU continues to recommend developing constraint-specific transmission demand curves.