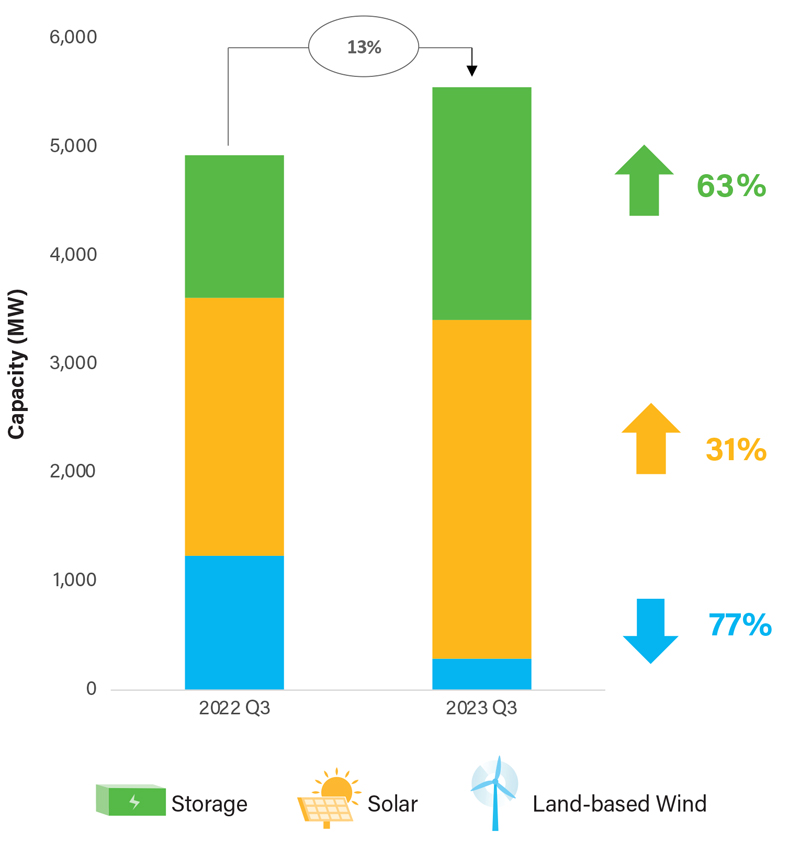
The U.S. grid added a record 5,551 MW of utility-scale solar, wind and storage in the third quarter of 2023, according to a new report released Wednesday from the American Clean Power Association.
The U.S. grid added a record 5,551 MW of utility-scale solar, wind and storage in the third quarter of 2023, according to a new report released Wednesday from the American Clean Power (ACP) Association.
But while the overall numbers in ACP’s Clean Power Market Report were strong — a 13% year-over-year increase in clean power capacity — the results for individual sectors were uneven. Utility-scale solar coming online jumped 31%, but new wind capacity fell 77%. Only two onshore projects totaling 288 MW came online, the lowest figures the industry has seen since 2013, according to the report.
Commercial and industrial (C&I) power purchase agreements (PPAs) were down 55% year over year, as buyers announced 3,175 MW of new contracts. According to the report, the drop reflects an ongoing slowdown in C&I PPAs.
At the same time, project delays continue to hamper industry growth. Developers put close to 23 GW of new capacity on hold last quarter because of delays, adding to other projects still unfinished from 2021 and 2022. Delayed capacity now stands at more than 56 GW, the report says.
While acknowledging such “near-term challenges,” ACP CEO Jason Grumet remains bullish on the U.S. clean energy market. The country currently has 243.4 GW of clean power capacity online, with a pipeline of 1,220 solar, wind and storage projects totaling an additional 128.2 GW, according to the report.
“The demand for clean energy is undeniable,” Grumet said, adding that the quarter’s “record-breaking numbers tell us that the U.S. clean energy sector continues to grow on a healthy, long-term trajectory.”
Other topline findings from the report include:
-
- The wind sector could bounce back from its disappointing quarter, with projects totaling 12,856 MW now under construction, including 803 MW that broke ground over the three months from July to September. Including projects under construction and in development, the total pipeline is now 22,135 MW.
- California took the No. 1 spot for new clean energy installations in Q3, with 1,900 MW of solar and storage added to the grid, but Texas still leads the nation in cumulative clean energy online — 56,948 MW — with No. 2 California trailing well behind, with 31,726 MW.
- Hybrid projects, mostly combining solar and storage, continue to grow, with 2,908 MW coming online, up 30% over the same period last year. At present, the U.S. has 18,447 MW of hybrid projects in operation, 80% of which are solar and storage.
Waiting on the IRA
What’s behind all those numbers is the ongoing push-pull of the federal incentives from the Infrastructure Investment and Jobs Act and the Inflation Reduction Act, and market forces from inflation to supply chain pressures and workforce shortages.
Like ACP, the Solar Energy Industries Association (SEIA) and Wood Mackenzie’s Solar Market Insight Report for the second quarter, released in September, noted that “the full benefits of the IRA have yet to materialize.”
But, for a change, the main problem is not project financing. “If anything, the amount of capital seeking high-quality solar project investments has only increased,” the SEIA-WoodMac report said. On top of inflationary pressures in the form of high interest rates and rising equipment and labor costs, developers are still uncertain about whether their projects will be able to qualify for IRA tax credits.
Despite guidelines issued by the Treasury Department, questions still linger. “As a result, the full benefits of the IRA, in the form of more development of solar projects that meet various policy objectives, won’t manifest until developers, asset owners and financiers have enough regulatory clarity to make confident investments,” the report says.
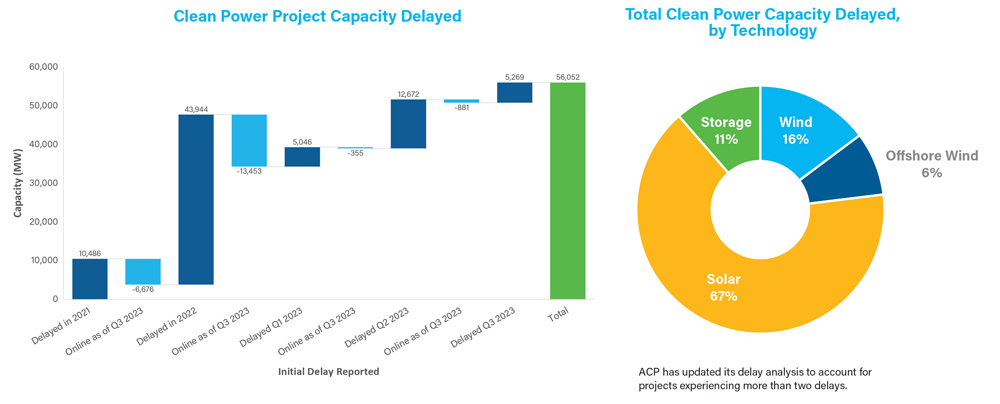
Looking at project delays, the ACP report says that on average, project delays run about 14 months, but 39% of delayed projects have experienced multiple setbacks — in some cases, five. Solar projects make up 67% of the delayed projects.
Still another caveat is that both the ACP and SEIA reports look at clean energy capacity, not generation, and few clean energy projects produce power at their full megawatt capacity. While renewables continue to outpace fossil fuels in new power added to the grid and waiting in interconnection queues, according to the Department of Energy, wind and solar combined now generate about 12% of U.S. electricity.