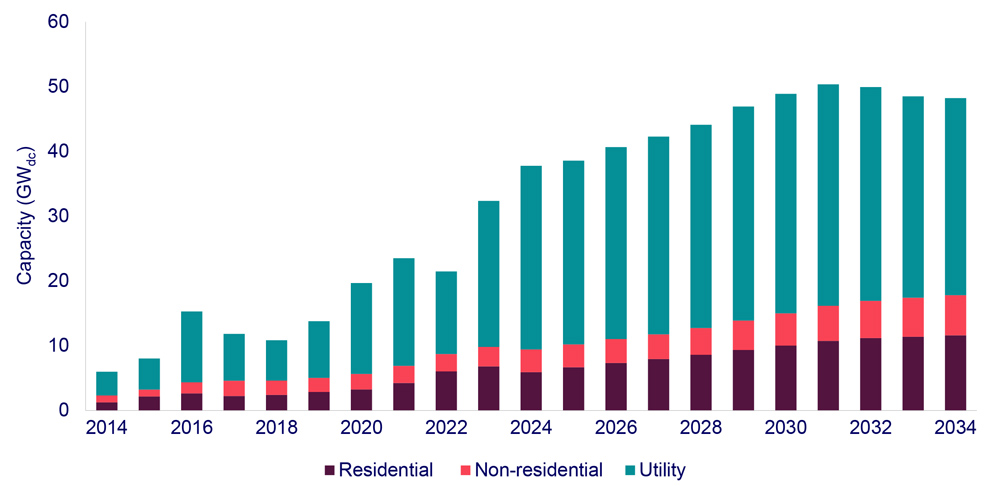
The U.S. could nearly quadruple solar capacity in the next 10 years, from the 177 GW installed at the end of 2023 to 673 GW by 2034, with solar providing the largest share of the nation’s electricity generation by 2040, according to a report released March 6 by the Solar Energy Industries Association and Wood Mackenzie.
But such exponential growth could depend on the right mix of policy and market conditions, SEIA and WoodMac caution in the report. In a “bull” scenario ― with few supply chain or interconnection constraints, and stable financing and access to tax credits ― an additional 85 GW of solar could be installed by 2034, the report estimates. But a less solar-friendly “bear” scenario could cut new capacity over the next decade by nearly 120 GW.
The result, the report says, is that “there could be a 200-GW swing in solar installations over the next decade. … The challenges that currently limit growth in this industry ― particularly transmission and interconnection limitations ― will only become more heightened over time. Addressing these limitations is key to meeting both decarbonization goals and growing power demand.”
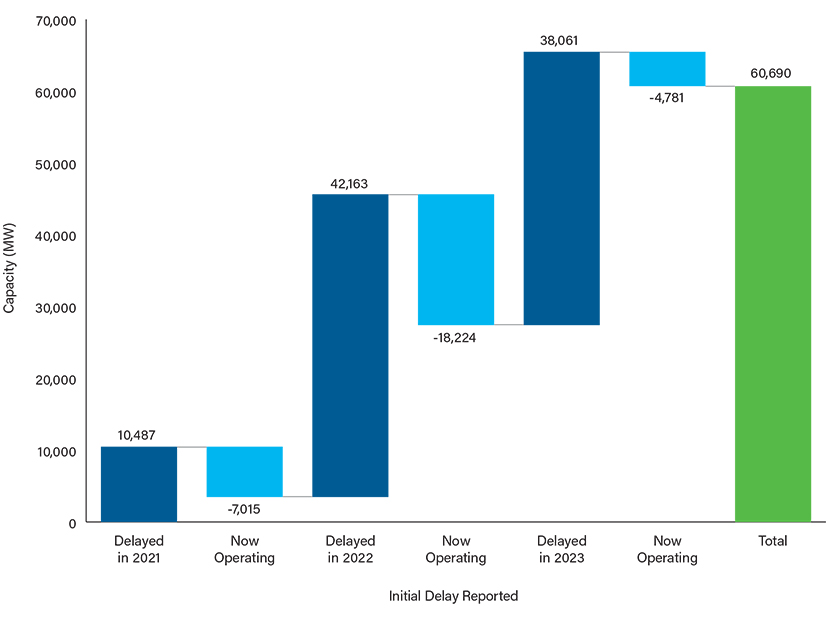
The more immediate effects of those limitations are detailed in a second report, the American Clean Power Association’s (ACP) 2023 Annual Market Report, released March 7. Over the past three years, delays on solar, wind and storage projects have put more than 60 GW of clean power capacity on hold, the report says.
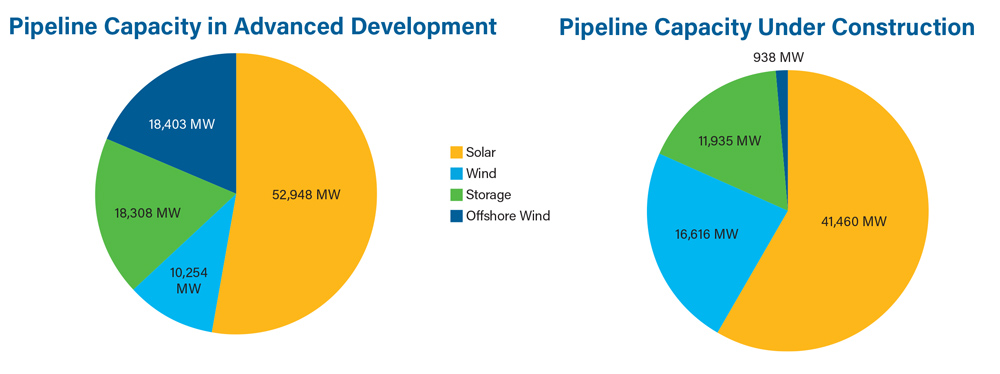
On the upside, the pipeline of clean power projects is healthy, with close to 71 GW of projects under construction by the end of 2023 and close to 100 GW in advanced development, meaning they have a firm equipment order and a power purchase or offtake agreement or other utility contract.
“The clean power pipeline experienced a 26% year-over-year growth from 135,221 MW at the end of 2022,” the ACP report says.
The two reports provide slightly different but complementary perspectives on the banner year clean power, especially solar, had in 2023. (All figures in the SEIA-WoodMac report are DC; the ACP report does not specify DC or AC.)
-
- Tracking only utility-scale projects over 1 MW, the ACP report says 33.8 GW of clean power — solar, wind and storage — came online in 2023. SEIA and WoodMac count 32.4 GW of residential, commercial and utility-scale solar projects combined. Both reports have solar at 58% of new power generation added to the U.S. grid.
- Both reports also put Texas in the No. 1 spot for new solar and clean power. On solar only, Texas and No. 2 California are neck and neck: 6,533 MW vs. 6,171 MW, respectively. But, counting solar, wind and storage, Texas leaves California in the dust: 9,931 MW to 5,590 MW.
- According to ACP, Texas and California together put more new clean power on the grid last year than the next 19 states combined.
- The ACP report also underlines the mainstreaming of clean power, with maps showing that every state in the union has some clean power. Wind energy provides more than 20% of electricity in 12 states, and solar delivers more than 10% of electricity in nine. The only state on both lists is Maine.
- More clean power than natural gas has been added to the grid every year since 2014, but natural gas also had a banner year in 2023, with 8,999 MW of new capacity coming online, a 27% increase over 2022, according to ACP.
The NEM 3.0 Effect
While both reports see solar as the dominant form of generation going forward, SEIA and WoodMac see some clouds on the horizon. Record installations notwithstanding, solar in general has been affected by higher interest rates and supply chain, interconnection and workforce challenges.
The residential solar market installed a record-breaking 6.8 GW in 2023, but a downturn is expected this year, primarily because of California’s introduction of much lower compensation rates for the power rooftop solar owners put back on the grid.
The new compensation plan — referred to as Net Energy Metering 3.0 — goes into effect in April and is especially disadvantageous for homeowners who only install solar panels, rather than solar and storage. Residential installations in California remained high through the first three quarters of 2023, as installers worked through a backlog of orders that would qualify for the previous, higher compensation, NEM 2.0.
But residential installations in the Golden State dropped 35% in the fourth quarter, and WoodMac says both high interest rates and the transition to NEM 3.0 will drive a 13% decrease in new residential capacity across the country this year. The California market could contract 40%.
Commercial solar could also feel a pinch from NEM 3.0, although a backlog of installations in California has been keeping figures high. This sector includes distributed projects with industrial, commercial, agricultural, school, government or nonprofit customers, and put 1,851 MW of new power on the grid in 2023, a 19% increase over 2022.
The report sees a dip coming in 2025 through 2027, again from NEM 3.0, but also from added costs related to the Inflation Reduction Act. To qualify for the law’s full 30% investment tax credit, commercial projects over 1 MW will have to pay prevailing wages and work with registered apprenticeship programs.
The extent of the impact here will depend on the final rules of the ITC, expected later this year.
The utility-scale solar sector ended 2023 on a record-breaking high note with 10.5 GW installed in the fourth quarter. But President Joe Biden’s two-year moratorium on tariffs on solar cells and panels from Cambodia, Malayasia, Thailand and Vietnam ends in June, which could result in higher prices and tighter supply chains.
WoodMac also notes that “high interest rates, tighter financing condition and interconnection uncertainty slowed contract negotiations,” which resulted in the utility-scale project pipeline falling to a record low of 83 GW.


