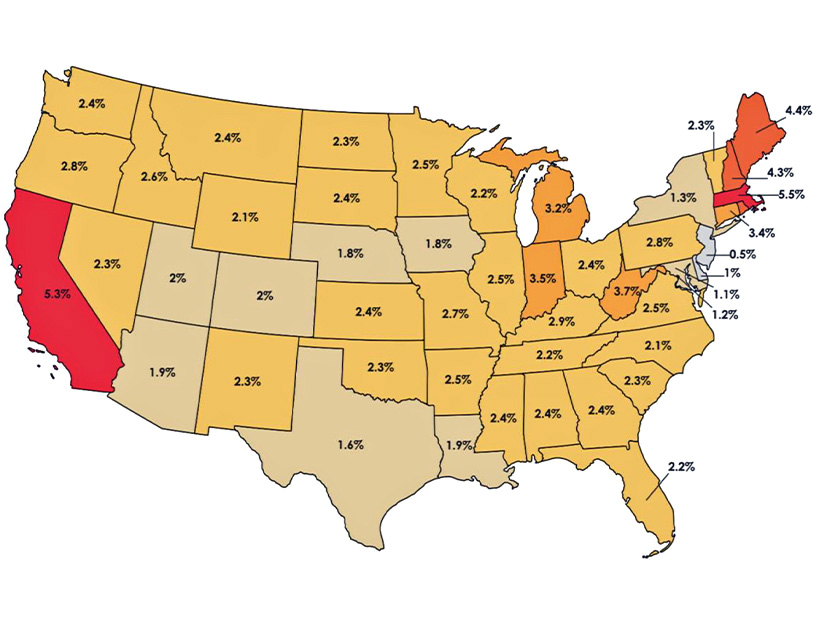
A new report says residential electric rates have been rising at a pace less than inflation in most states since 2010 and that the clean energy transition is not driving the increase.
Broadly, transmission and distribution costs are rising faster than inflation, and this is a driving factor behind electric rates increasing nationwide, the report says; more narrowly, wildfires, natural gas price volatility and investments in coal plants contributed to price hikes in certain markets.
“Clean Energy Isn’t Driving Power Spikes” was announced July 9 by Energy Innovation Policy & Technology, an energy and climate change think tank working to support policy designs intended to reduce emissions.
The issue of rising electric bills is real, Energy Innovation said in introducing the report, and it is a huge concern for many American families.
But clean energy, which some opponents criticize for its cost, is not to blame, the organization concludes. In fact, some of the smallest electric rate increases have been in states with high rates of wind and solar generation, such as Iowa, Kansas, Oklahoma and New Mexico.
In ERCOT, for example, the buildout of wind and solar is estimated to have reduced wholesale electricity costs by $31.5 billion between 2010 and 2022, $11 billion of that in 2022 alone.
Since 2010, average residential electric rates and the U.S. Consumer Price Index both have increased about 40%, the report notes, but average bills have increased only 24%, because of reduced household energy use. Energy-efficiency measures and rising use of distributed resources such as rooftop solar are credited for this.
California, with one of the most aggressive clean energy stances of any state, has seen substantial electricity rate increases in recent years. But the report blames wildfire-related investments such as vegetation management and grid investments, which have increased to 16% of the total consumer costs for the state’s three primary investor-owned utilities.
The grids in Colorado, Hawaii, Oregon and Texas also have sustained damage from major wildfires.
“As climate-related risks accelerate, the cost to electricity customers of mitigating these risks will be critical to address,” the report states.
The volatile price of natural gas is identified as another contributing factor in some states, particularly Massachusetts, which drew 64% of its electricity from gas-fired generation in 2023, compared with 49% for ISO-NE as a whole.
The report flags other factors linked by a common theme: A regulated, guaranteed rate of return incentivizes utilities to make large capital investments rather than operational investments or other options that might be more cost-effective for customers.
The report notes, for example, that utilities are continuing to invest in aging coal plants to keep them running, taking on significant new debt in the process.
The report cites data from RMI showing the average remaining plant balance increased from $560/kW of capacity to $745 from 2010 to 2020 for steam boiler power plants, a category that consists mainly of coal-fired facilities. These sunk costs (plus a regulated rate of return) are passed along to ratepayers.
Transmission and distribution costs are increasing at nearly double the rate of inflation, the report says, because of utility investment in hardening and resilience. It suggests costs could be limited by maximizing the existing grid’s potential with grid-enhancing technologies and reconductoring existing transmission corridors.
The report cites Edison Electric Institute data showing IOUs boosted their capital investment in transmission and distribution infrastructure 64% from 2016 to 2023, more than double the rate of inflation during the same period. EEI indicates that transmission and distribution costs rose from one-fifth to one-third of total electricity revenue requirements from 2010 to 2022.
This capital investment has been across the board, including from utilities that serve areas with slower growth of emissions-free generation, the report said, suggesting again that the rise of renewables is not driving the spending.
The report states that these cost pressures risk canceling out the potential savings offered by renewable energy, the cost of which is expected to decrease through 2030.
It offers several suggestions: Utilities can adopt better planning processes, use competitive procurement processes, maximize the capacity of the existing grid, enhance regional cooperation, refinance coal debt, adopt fuel cost-sharing mechanisms and change their business models to incentivize energy efficiency for customers rather than incentivizing their own capital investments.


