

A new report finds that the percentage of renewable energy generation additions associated with renewables portfolio standards (RPS) has declined since this century began as development increased.
The 2024 edition of the report by the Lawrence Berkeley National Laboratory indicates most of the 29 states with an RPS have met their targets in recent years but most clean electricity standards (CES) targets are not yet in force.
“U.S. State Renewables Portfolio & Clean Electricity Standards: 2024 Status Update” also summarizes recent legislative revisions, key policy design features, compliance with interim targets, impacts on clean electricity development and compliance costs.
The report’s accompanying spreadsheets drill down to more granular detail in individual states, including demand projections, nominal percentage targets and retail electricity sales projections.
Berkeley Lab will host a webinar on the report Aug. 28.
Report Details
The report offers a broad perspective on aspects of the clean energy transition and the role RPS and CES policies play in it.
Among the details:
-
- Twenty-nine states and the District of Columbia have RPS policies; 16 of those have final targets of at least 50% retail sales, and four have a 100% RPS.
-
- Sixteen states have a 100% CES; all but one of those also have an RPS.
-
- While RPS-related capacity additions have increased over time, they have shrunk as a percentage of new renewable energy construction — 35% in 2023, compared with 60 to 70% per year 10 to 15 years earlier.
-
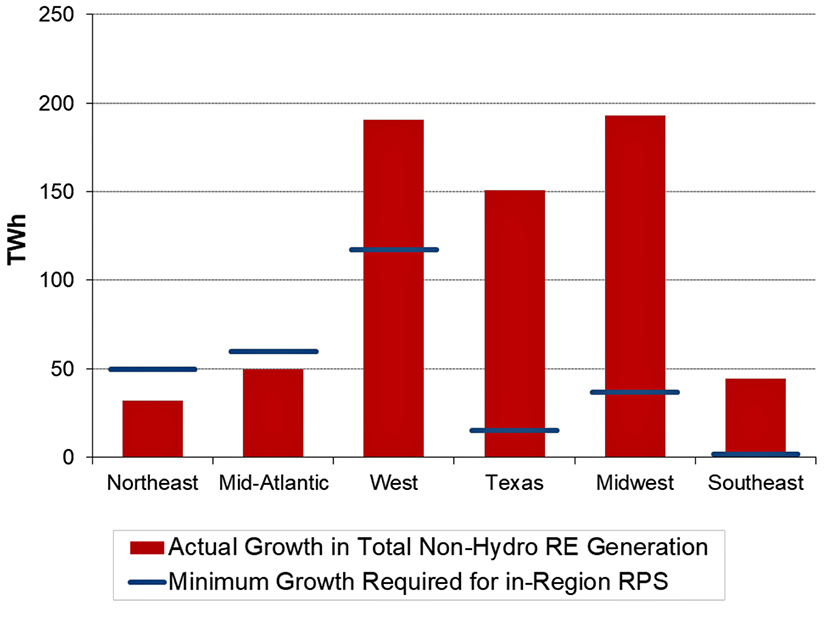
- The authors acknowledge the difficulty of attributing growth of renewable energy to one factor, but they say RPS policies have been a key driver; nonhydro renewable generation increased by 648 TWh from 2000 through 2023, but RPS and CES policies required only 280 TWh of growth.
-
- Aggregate RPS requirements rise from 450 TWh in 2024 to 930 TWh in 2050; CES requirements begin to ratchet up in 2030 and reach 770 TWh by 2050.
-
- New interregional transmission could reduce resource needs for both RPS and CES; retirements of nuclear, large hydro and other existing assets would increase those resource needs.
-
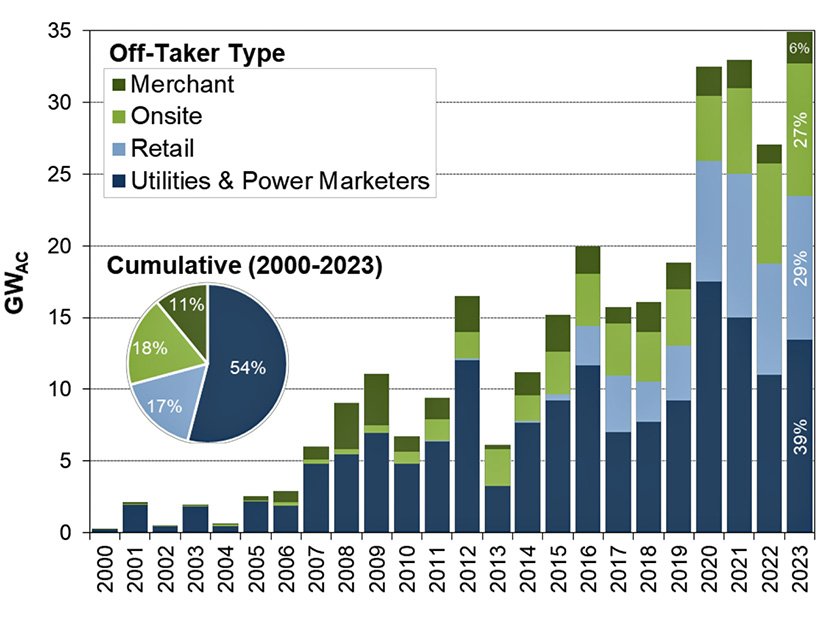
- A total of 35 GW of renewable capacity was added in 2023; the largest off-taker was load-serving entities, at 39%, but retail off-takers continue to grow, accounting for 29% of new capacity in 2023.
-
- The voluntary market — targets adopted or imposed beyond RPS and CES — might absorb a larger portion of new generation than assumed in the report.
-
- In 2023 and the first quarter of this year, 112 pieces of RPS- and CPS-related legislation were introduced, but only 13 were enacted into state law; 24 of the proposals would have weakened the standards, but none were signed into law.
The report concludes that the future impacts of state RPS and CES programs will depend on multiple factors, including:
-
- whether states decide to expand and broaden their programs;
-
- the types of implementation and enforcement mechanisms established;
-
- efficacy of federal policy in stimulating new clean electricity supplies and transmission;
-
- efforts to address issues surrounding renewable energy integration, permitting and interconnection; and
-
- the price trajectories of renewable energy construction and renewable energy certificates.


