

The 2024 editions of the U.S. Department of Energy’s wind energy market reports show growth amid challenges.
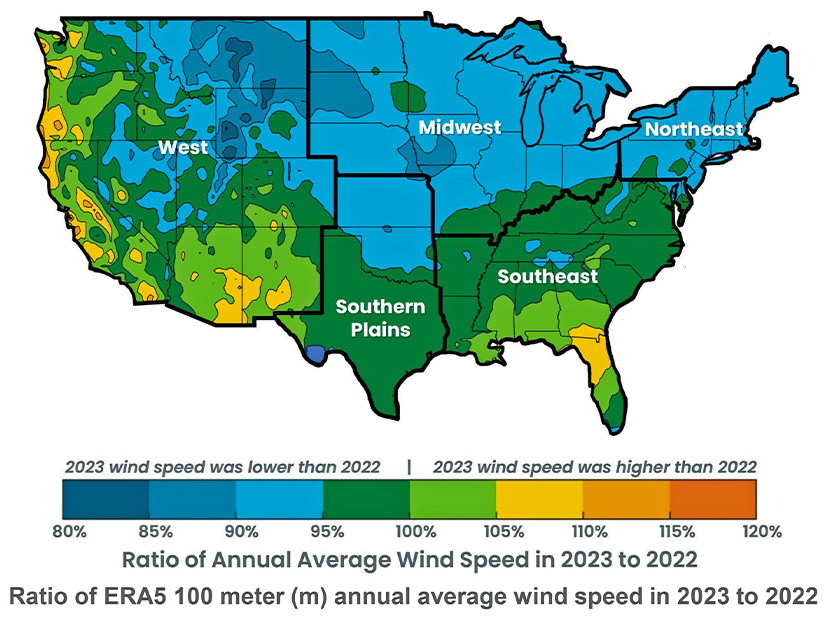
Utility-scale onshore wind capacity increased by 6.5 GW in 2023. While that represented a $10.8 billion capital investment, it was the third consecutive annual decline, and the smallest capacity addition since 2014.
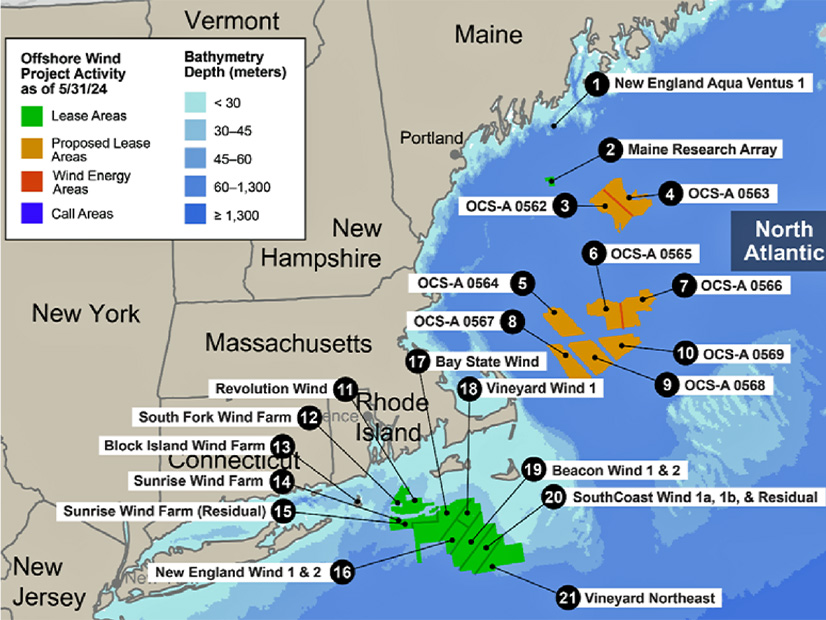
The emerging U.S. offshore wind industry ran into serious problems in 2023, and by May 2024, there still was only 174 MW operational in U.S. waters. But three projects totaling 4,097 MW were under construction, and four other projects totaling 3,378 MW had been permitted.
Distributed wind capacity nationwide reached 1,110 MW with the addition of 1,999 new turbines in 16 states in 2023. This was more turbines than were added in 2022 or 2021, but the cost and the capacity of those additions was greater than in 2023.
DOE’s Wind Energy Technologies Office funded the reports, which were compiled by three DOE national laboratories.
The office said in a news release that the policies of the Biden administration and funding from the Inflation Reduction Act have accelerated the wind energy sector to the point that it accounted for more than 10% of electricity generated and 12% of capacity added in the United States in 2023.
It said the U.S. project pipeline is 53% larger than a year ago and projected that annual capacity additions would exceed 15 GW by 2026 and be nearly 20 GW by 2030.
Onshore Wind
The Land-Based Wind Market Report was prepared by Lawrence Berkeley National Laboratory.
Highlights include:
-
- Installed capacity surpassed 150 GW in 42 states, with Texas leading in nameplate capacity (41,594 MW) and Iowa leading in percentage of in-state electricity generation (59.2%).
-
- General Electric built the majority of wind turbines installed in the U.S. in 2023 — 58%. Vestas was a distant second at 30%. Nordex and Siemens-Gamesa Renewable Energy accounted for 9 and 4%, respectively.
-
- The U.S. wind industry continues to rely on imports, although the IRA has created renewed optimism about domestic supply chain expansion; annual U.S. production capacity at the end of 2023 stood at 15 GW for nacelle assembly, 12 GW for tower manufacturing and 4 GW for blade manufacturing.
-
- Independent power producers own over 90% of the new wind capacity installed in 2023.
-
- Direct retail purchases of wind power, including corporate offtakers, led the market for new wind energy capacity for a second year in a row, buying electricity from at least 48% of the new facilities; electric utilities were a distant second at 29%.
Offshore Wind
The Offshore Wind Market Report was prepared by the National Renewable Energy Laboratory (NREL).
Highlights include:
-
- Using the broadest definition, including the maximum potential capacity of lease areas that are newly designated but not yet sold, the U.S. offshore wind pipeline grew 53% to 80,523 MW as of the end of May.
-
- Just over 25,000 MW of that pipeline calls for floating wind turbines, which still are in the development stage and are not expected to be installed in U.S. waters at commercial scale anytime soon.
-
- Estimated investment in the U.S. offshore wind supply chain has reached $10 billion since President Biden took office; NREL has estimated the need to be at least $22 billion.
-
- State-level policies continue to drive offshore wind development; as of May 31, mandates in eight states total 45,703 MW and non-binding planning targets in five states total 69,427 MW.
-
- Fifteen contracts to purchase 12,378 MW from offshore wind farms have been signed.
-
- The report tallied 68,258 MW installed capacity worldwide as of December 2023, less than 100 MW of it in the United States.
Distributed Wind
The Distributed Wind Market Report was prepared by the Pacific Northwest National Laboratory.
Highlights include:
-
- Ohio, Illinois and Alaska accounted for 78% of the distributed wind capacity added in 2023.
-
- Large turbines (larger than 1 MW) accounted for 69.5% of capacity added; midsize turbines (101 kW to 1 MW) accounted for 8.6%; small turbines accounted for 21.9%.
-
- The major distributed projects in 2023 were a 4.5-MW facility for a lime manufacturing plant in Ohio, a 2.8-MW facility to support an EV maker’s plant in Illinois and a 0.9-MW facility to serve communities in Alaska.
-
- Only 11% of distributed wind installed in 2023 feeds into the grid for local use, while 89% was installed to supply an on-site use; this was an aberration caused by two particularly large projects at industrial sites.
-
- Significant activity and investment in the small wind market in 2023 suggests development might increase in coming years.


