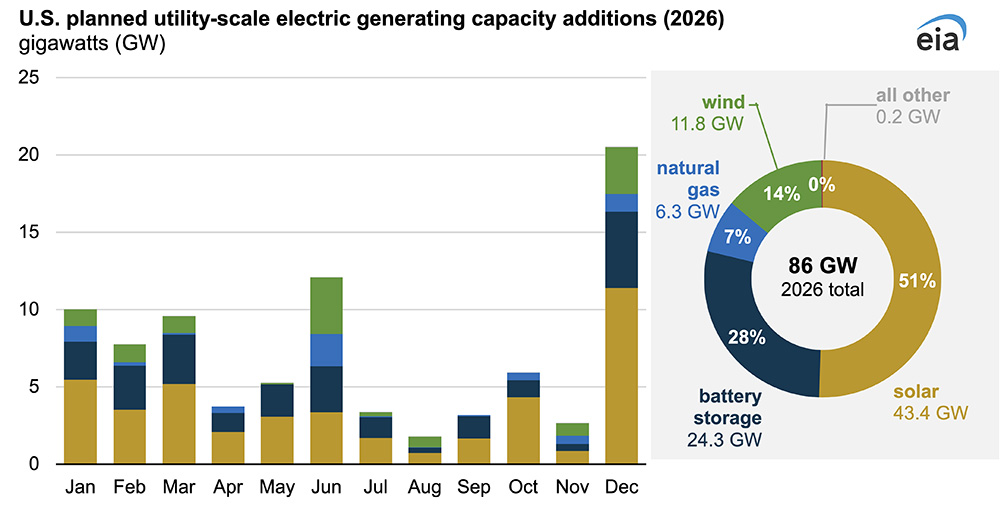
A record 86 GW of utility-scale generation capacity is projected to be added to the U.S. power grid in 2026.
The Energy Information Administration (EIA) said Feb. 20 that if the plans reported by power plant developers and operators come together as expected, they would far outpace the 53 GW of capacity added to the grid in 2025, which was the most since 2002.
Rising demand expected from new data centers and other larger loads has touched off a scramble to add power generation.
But details of the EIA analysis suggest the surge projected in 2026 is rooted at least in part in the clean energy push of the Biden administration, rather than the fossil-heavy energy dominance push of the Trump administration.
EIA calculated 43.4 GW of solar, 24.3 GW of battery storage and 11.8 GW of wind coming online in 2026, or 93% of the 86 GW total.
Just 6.3 GW of new utility-scale natural gas capacity is expected.
Given the time frames involved in development, permitting and interconnection, the Biden-era surge of renewables development still is in process in the second year of the Trump administration and the Trump 2.0 push for fossil generation has not yet resulted in extensive construction.
President Donald Trump engineered an accelerated phaseout of the lucrative federal tax credits President Joe Biden engineered for solar and wind development, so there is additional impetus for renewables developers to accelerate construction of their projects.
EIA broke the numbers down by geography and technology:
-
- The 43.4 GW of new solar would be a 60% increase over 2025.
- Texas is the site of 40% of the planned solar construction; rounding out the top three states are Arizona and California, at 6% each.
- The 24.3 GW of new battery capacity expected in 2026 would continue the technology’s five-year streak of exponential growth in the U.S. and would far surpass the record 15 GW installed in 2025.
- Three states account for most of the new batteries expected to come online in 2026: Texas (53%), California (14%) and Arizona (13%).
- Annual wind power additions have slumped since exceeding 14 GW in both 2020 and 2021; the 11.8 GW projected in 2026 would not be a complete rebound but would be more than double the amount that came online in 2025.
- Four states account for nearly 60% of the wind total: New Mexico, Texas, Illinois and Wyoming.
- The largest onshore wind project in the nation, New Mexico’s 3,650-MW SunZia, is expected to start commercial operation in 2026, as are the nation’s first two large offshore wind projects, the 710-MW Revolution Wind and the 800-MW Vineyard Wind 1 along the New England coast.
- Combined-cycle generation accounts for 3.3 GW of the 6.3 GW of natural gas capacity expected to be added in 2026; the planned combustion turbine units total 2.8 GW.
- Florida, Ohio, Oklahoma, Tennessee and Texas together would host more than 80% of the gas-fired capacity additions.
- The 1,158-MW Orange County Advanced Power Station in Texas is the largest single gas addition expected in 2026.
- Generation additions for all other technologies are expected to total approximately 0.2 GW.
EIA has not released full data for electrical generation in 2025.
But the most recent electric power monthly update indicates that through the first 11 months of 2025, significant changes in utility-scale generation were seen with solar (34.5% higher than the first 11 months of 2024), coal (13.8% higher) and natural gas (3.7% lower).
Also in the first 11 months of 2025, U.S. electricity consumption was 2% higher, the average price was 5.3% higher and revenue from sales was 7.4% higher.