NYISO energy prices sank to 11-year lows during the first quarter, ranging from $15 to $35/MWh, stakeholders heard Tuesday.
“This is the lowest quarterly average level in more than a decade, so it’s pretty exceptional,” Pallas LeeVanSchaick of Potomac Economics said as he presented the Market Monitoring Unit’s State of the Market report for the first quarter to the Installed Capacity/Market Issues Working Group.

Natural gas prices also dropped to their lowest quarterly average since 2009, along with electricity loads, LeeVanSchaick said.
“That was really attributable to a combination of factors, including mild weather conditions, the growth in energy efficiency and behind-the-meter solar, as well as in March we saw the effects of the COVID-19 pandemic, which many of you have heard about reducing load 8 to 9%,” he said.
Congestion Patterns and Revenues
Lower load levels and natural gas prices led to relatively low levels of transmission congestion, supplemental commitment for reliability and imports from PJM, he said.
While congestion was generally mild, the pattern was typical, with the most significant congestion observed on the Central-East interface, which accounted for about 60% of the day-ahead congestion revenues in the first quarter, LeeVanSchaick said. The pattern is typical because gas spreads tend to be largest between western and eastern New York; however, the difference dropped from 32% in the first quarter last year to only 11% in the same period this year, he said.

Day-ahead congestion revenues totaled $56 million, down 49% from the first quarter of 2019, primarily because of lower gas prices and load.
“We also saw New York City [Zone J] constraints account for the second largest share of congestion in the first quarter of 2020, but it was mainly localized to the Greenwood load pocket, because a 138-kV Gowanus-Greenwood line was out of service for a lot of January and February, which reduced transfer capability into the Greenwood load pocket,” LeeVanSchaick said.
While congestion fell by more than 40% in other regions, congestion in Zone J fell just 16% in the day-ahead market and rose 135% in real time. “So that pocket accounted for most of the New York City congestion, which otherwise would have been relatively small,” he said.
Out-of-market Actions
“In this quarter, we saw a significant reduction in the amount of out-of-market actions to manage low-voltage constraints in New York. Not so much a reduction quarter over quarter, but over the last two years we’ve seen big reductions,” LeeVanSchaick said.
The ISO achieved the reductions by modeling most 115-kV constraints in the day-ahead and real-time market models, the report said.
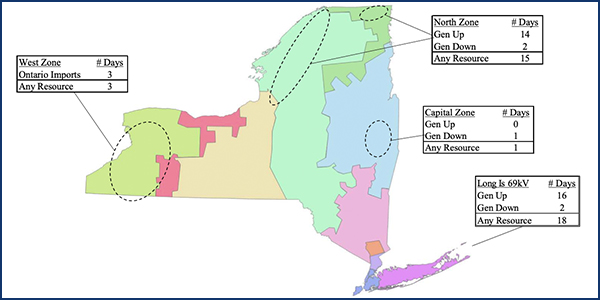
“In the West Zone, there were just three days of out-of-market actions where Ontario imports were curtailed to manage Gardenville-to-Dunkirk constraints,” LeeVanSchaick said.

Fifteen days of out-of-market actions in the North Zone were predominantly times when the Saranac unit was subject to a supplemental resource evaluation to provide congestion relief as well as operating reserves, while big reductions in the Capital Zone were driven by transmission upgrades, he said. Long Island had 18 days of out-of-market actions, the frequency of which was reduced by low load levels.
“We did see big reductions in the amount of supplemental commitment for reliability … which was obviously way down both in terms of local reliability rule [LRR] commitments and day-ahead reliability unit commitments,” LeeVanSchaick said.
On LRR commitments in New York City, where the ISO is modeling specific load pockets, he showed how the hourly requirement often came in below the static daily requirement, usually because of thermal and voltage constraints that required certain amounts of resources to be committed in certain areas, as the LRR path determines the quantity of resources that are needed on a given day.

“If we look in the places where commitments occurred … in terms of the hourly requirement for resources, in [these pockets] you probably need a little over 100 MW in the overnight, but over the peak you need something that averages more like 280 MW,” LeeVanSchaick said.
“One thing to note is the actual requirement that’s used in the day-ahead software is a static, 24-hour requirement, so if at the peak, 280 MW is needed, even though that’s a subset of the hours, the static requirement is essentially imposing that in all 24 hours. So in this quarter, we did see that that led to additional hours of commitment,” he said.

The MMU did recommend the ISO examine whether it’s possible to represent the requirement only in the hours where the resource is needed in order to avoid excess commitment of generation.
One stakeholder asked whether different resources would be selected if NYISO could better tailor the hourly requirements.
“In principle that could definitely happen,” LeeVanSchaick said. “I don’t recall that being something we observed in this quarter, but of course it would vary over time and under some conditions that could change the selection.”