
The ISO-NE Planning Advisory Committee last week heard the RTO’s latest study results on integrating up to 8,000 MW of offshore wind into the regional grid. The New England States Committee on Electricity (NESCOE) had requested the analysis.
At the April 2019 PAC meeting, Anbaric Development Partners and RENEW Northeast requested separate analyses, which are still under development.
Patrick Boughan, ISO-NE senior engineer for system planning, presented the NESCOE 2019 Economic Study for four scenarios with 8 GW of offshore wind additions connected in varying amounts to five different interconnection points.

“For these scenarios, as opposed to our preliminary results that were presented in December, we’re using 2015 as the base weather year,” Boughan said. “That means the shape of the load, wind and solar curves is based on the 2015 weather year, but it’s at 2030 values based on our forecast.” (See ISO-NE Planning Advisory Committee Briefs: Dec. 19, 2019.)
“We don’t see any significant transmission interface congestion being caused by offshore wind in any of the 8,000-MW scenarios,” he said. “We will be doing a more detailed analysis of transmission congestion [and] also estimated costs for required upgrades.”
That analysis may find congestion within the Regional System Plan that is not caught in a more general study, Boughan said.
Differences among the scenarios are driven by different volumes of energy from wind resources, which led the planners to increase the Surowiec-South interface limit to 2,500 MW from the 1,500 MW used in the preliminary results, he said.
“We see 15 TWh of spillage [yearly], which is imports, hydro, wind and solar together, in these 8,000-MW scenarios, with some slight variation among them. However, we do see significant variation in how much spillage there is by month [0.15 to 2.69 TWh],” Boughan said.

Increased offshore wind production shows the same positive trends as seen with lower levels, such as lowered use of natural gas production and imports, and significant decreases in production costs, LMPs, load-serving entity energy expenses and carbon emissions.
Heat pumps and plug-in electric vehicles make up only 4% of projected 2030 annual net load, which spikes to about 10% during winter evening peaks. This load addition is often served by storage or energy that would otherwise be spilled, he said.
Wind/Power Time Series Modeling
ISO-NE’s lead engineer for system planning, Steven Judd, reviewed the need for a new wind data power time series and the assumptions used to create the data.
The RTO hired consultancy DNV GL to create a new historical data set for both onshore and offshore wind. It said three of its ongoing studies require wind data, including 2019 Economic, Energy Security and Transmission Planning studies.
“With those three studies, the [RTO] decided we needed to go out and try to find a different area of trying to build this historical wind data output, [as if] those offshore wind farms have been built,” Judd said. “So how do you get historical data?
“DNV GL is already performing our operational wind forecasting, so they have the data on our onshore wind farm layouts, turbine types and power curves for the existing fleet,” Judd said. “This project will allow the [RTO] to update the time series in the future to continue to calibrate and expand our data set as new years of history go on.”

Chris Hayes of DNV GL presented wind and power time series modeling of ISO-NE wind plants, which combined mesoscale and power time series modeling capabilities to produce simulated wind plant time series for 38 existing and 11 future — or hypothetical — wind plant locations.
“The data set for this particular study is confidential to ISO New England and is not publicly available,” Hayes said.
Because the mesoscale model is not perfect, the researchers generally use land-based wind farm performance measurements to calibrate the data sets, including for the wind energy areas off Nantucket, he said.
For the future or hypothetical wind plants in the Bureau of Ocean Energy Management lease area, increased variability in the offshore wind power time series versus onshore wind appears to be caused by a combination of the “portfolio effect,” stronger winds and a broader shape to the wind-speed frequency distribution, Hayes said.
The “portfolio effect” refers to increased geographic dispersion of onshore wind plants resulting in decreased variability of aggregate generation, which reduces the risk that a single weather system will impact the generation of all plants in the region at the same time.
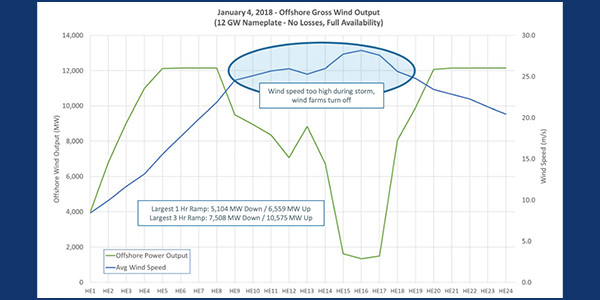
“It doesn’t appear that the increase in potential variability applies necessarily to the hour-to-hour wind ramps or generation changes,” Hayes said. “We generally don’t have hour-to-hour changes that could drop aggregate generation at full capacity down to nothing. Those changes generally take a little bit more time.”
For operational purposes, although the offshore time series may have a larger range of possible generation values or likely values for each hour of the day, the change from one hour to the next is not necessarily going to be significantly greater than onshore, he said.
– Michael Kuser


