Meeting New York’s ambitious clean energy goal of having the first grid in the country to reach 100% emissions-free electricity will require an “astonishing” 80 GW of new generation by 2040, NYISO stakeholders heard Monday.
Brattle Group representatives presented the Installed Capacity/Market Issues Working Group their final analysis of the state’s evolution to a zero-emission power system.
The report included three “alternative scenarios” modeling operations and investment in scenarios of increasing electrification for the years 2024, 2030 and 2040, as stakeholders had requested when presented the base case modeling in May. (See NYISO Examines ‘Evolution’ to Zero Emissions.)
“This is a sweeping study of a complete transformation of the system over the next two decades,” Brattle’s Sam Newell said. “By 2030 the system would need about 35 GW of additional wind and solar to meet the 70% renewable goal, and 80 GW relative to today of new wind and solar by 2040 to get to zero carbon.”
Signed into law last July, New York’s Climate Leadership and Community Protection Act (CLCPA) mandates, among other targets, that 70% of the state’s electricity come from renewable resources by 2030 and that generation be 100% carbon-free by 2040. (See Cuomo Sets New York’s Green Goals for 2020.)
“That means adding about 4 GW per year of onshore wind, offshore wind and solar in some combination,” Newell said. “That’s an astonishing pace.”
As part of its “Grid in Transition” initiative, the ISO retained Brattle to simulate the resources that can meet state policy objectives and energy needs in order to inform planning for reliability and market design over the next two decades. (See N.Y. Looks at Grid Transition Modeling, Reliability.)
Three Scenarios
Brattle developed three scenarios to address a range of questions from NYISO and stakeholders, including: an existing technologies case; a increased flexibility case (with expanded interties to Hydro-Québec); and an expanded transmission case (with new lines southbound).
The study is modeling for a 20-year time horizon. Given the amount of uncertainty about what available technologies, costs, and state and market rules will be, the ISO and its stakeholders thought it was important to use alternative scenarios to get a sense of how much the results change under different assumptions, said Brattle Senior Associate Roger Lueken.
“One thing to stress is that there is a lot of uncertainty in the study both in terms of the setup and the results,” Lueken said. “Of course, there’s a lot more scenarios that we could look at, but these were the three that it sounded like were of most interest.”
The study compares each of the scenarios to the high electrification case and to the base case results, he said.
In addition to the CLCPA, a key public policy driving decarbonization of the grid is the Regional Greenhouse Gas Initiative, the Northeast regional cap-and-trade program that had an average 2019 price of $5.40/ton of carbon dioxide, which is expected to reach $12.60/ton by 2030.
The study also considers the zero-emissions credit (ZEC) program for payments to New York nuclear plants, which expires March 2029, and the Department of Environmental Conservation rule to reduce NOx emissions from peaking plants, whereby peakers built before 1986 will most likely retire instead of retrofitting to meet emissions requirements.
The state’s new emissions regulations go into effect May 1, 2023, and generator compliance plans were due March 2. (See NY DEC Kicks off Peaker Emissions Limits Hearings.)
Through the Looking Glass
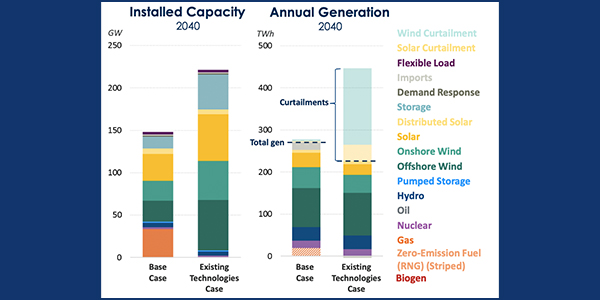
The existing technologies case for 2040 gives high-level insights into a large overbuild of renewables (+80 GW from current levels) and storage (+27 GW) to meet load in all hours, with large curtailments of 221 TWh, or 50% of projected generation.

In addition, retirement of gas plants by 2040 causes unforced capacity reserve margins to fall below planning reserve margins, and load falls by 50 TWh without in-state renewable natural gas production.
“In the second case — increased flexibility — we model expanded interties to Hydro-Québec as being able to provide flexibility, and we model more flexible load on the system,” Lueken said.
Lueken said “there are many different ways load can be flexible,” but Brattle chose to focus on two.
“The first is controlled electric vehicle charging, so people with EVs can control at what time of day they charge,” he said. The second is controllable heating and air conditioning loads, with the study assuming that buildings are outfitted with smart thermostats or types of HVAC that allow occupants to vary their thermostat point in order to shift their load from hour to hour.

“The third case is an expanded transmission case where we model transmission along key corridors from upstate New York into downstate New York, and between Zone J [New York City] and Zone K [Long Island],” Lueken said.
The New York Public Service Commission in May authorized a study to identify distribution upgrades, local transmission upgrades and bulk transmission investments needed to meet the state’s clean energy goals (20-E-0197). (See NYPSC Launches Grid Study, Extends Solar Funding.)
The third case is designed to show how the amount of transmission affects what types of resources are built and where they’re added.
Brattle made three specific updates to the scenario. The first update was increasing transmission from zones A through E (Western to Central New York), and to zones G, H and I (Central and Lower Hudson) by 2,000 MW, and more than doubled the base case transfer limit from 1,900 MW to 3,900 MW, Lueken said.

“The second update was increasing transmission from zones G, H and I into the Zone J by 2,000 MW, upping the transfer limit in the base case from 3,900 MW to 5,900 MW. Both of those upgrades were unidirectional, so we only increased the flow limit in the downstate direction,” Lueken said.
The third update was applied bidirectionally, assuming that the transmission lines between zones J and K increase by 1,000 MW, so that an additional 1,000 MW can flow from J to K and vise-versa, he said.
In response to a question about assumed costs for the transmission buildout, Lueken said “we did not compare the cost of building the increased interties to Hydro-Québec to the benefits; we simply reasonably assumed that they occurred and checked what happens to the resulting resource mix. The same is true here — we don’t make assumptions about what these upgrades cost, and we don’t compare the benefits of these upgrades to some estimate of what they might cost.”
Merits a Closer Look
The study’s main point is that the projected renewable needs for 2030 are in line with the technical potential for renewables in New York, but projected needs for 2040 will possibly exceed that potential, Lueken said.
He reiterated his cautionary note about the uncertainty around what the actual limits are, especially the estimates from the Department of Public Service, the New York State Energy Research and Development Authority and the National Renewable Energy Laboratory.
“One thing that might be worth further study by the Iabs or by the state or someone is getting a better sense of what these limits really are, and how that might influence the types of resources that are built,” Lueken said. “This is most obvious looking at solar, where for the amount of potential the limits range from 7 GW to 50 GW to almost 1,000 GW.”
Newell wrapped up the presentation by emphasizing Lueken’s last point: “The one area for further study is how do these needs relate to resource potential, including how much offshore wind you can get without transmission being built to access whatever lease sites are developed.”
“In any case, we’re talking about massive amounts of intermittent resources that are difficult to rate properly in terms of capacity,” Newell said. “Their intermittency is accounted for in installed capacity reserves studies, but they’ve become such a big part of the system, it’s worth taking a closer look at how you look at multiple years of wind and solar data, and more robustly incorporate that into the analysis, and extend that to resource accreditation.”