
NYISO energy markets performed competitively in the second quarter of 2020, with the economic shutdown caused by the COVID-19 pandemic leading to the lowest load levels and average fuel prices seen in more than a decade, according to the Market Monitoring Unit.
“Demand was extremely low, and fuel prices were extremely low,” Pallas LeeVanSchaick of MMU Potomac Economics told the ISO’s Installed Capacity/Market Issues Working Group on Tuesday in presenting its quarterly report on the markets.
“All-in prices ranged from $15 to $61/MWh, down 9 to 31% from 2019 in all regions except New York City, which saw an increase of 12% because of the higher capacity prices we saw there,” LeeVanSchaick said.
For the first time in more than a decade, capacity costs constituted the majority of the city’s all-in prices (71%), compared to the usual third or so, because of an increased locational minimum installed capacity requirement (LCR) and very low energy prices, he said.

Energy consultancy ICF International in June 2018 highlighted the possibility of increasing capacity prices in New York City, citing NYISO’s revised assumptions and references for its buyer-side mitigation analysis that forecasted the LCR for the city at 2.5 to 4.5% above its then-current level of 80.5% in the 2020/2021, 2021/2022 and 2022/2023 capability years, saying the “higher LCRs are equivalent to approximately 320 MW of demand in 2020 and 550 MW in 2021 and 2022.”
The report said the actual LCR rose from 82.8% to 86.6% in New York City. Capacity costs fell by 5% on Long Island and 40% in the Lower Hudson Valley but rose by 64% in the city and doubled in the Rest-of-State regions, both from changes in demand and supply.
“In ROS, Kintigh retired at the end of March, and both Cayuga units retired in June, marking the end of the coal era in NYISO,” he said.
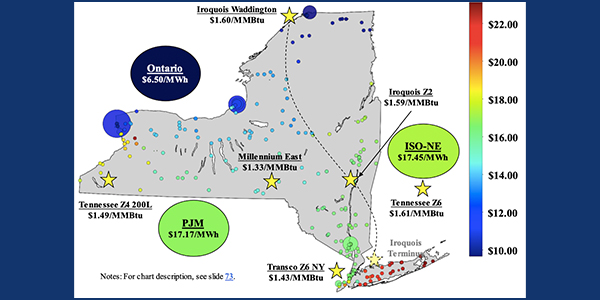
Natural gas prices continued to fall, with quarterly averages being the lowest witnessed over the last decade, regardless of season: $1.43/MMBtu at the Transco Z6 hub, down from $2.25/MMBtu in the same quarter a year ago.
Swing Low and Loose
The 5% average load reduction was a decrease against what had previously been the lowest second-quarter load in more than a decade, although peak load levels were consistent with last year because of a heat wave in June that drove energy demand higher.
The pandemic had a significant reductive impact on loads, reducing New York City’s load by 11%, based on weather-normalized values. The pandemic drove most of the load reduction from 2019, continuing the trend seen in the first quarter. (See NYISO Q1 Energy Prices Hit 11-Year Low.)
Generation patterns and capacity supply changed with the retirement of the Indian Point 2 nuclear unit, as well as the last two coal plants in the state, and some of those impacts were offset by the new entry of the Cricket Valley Energy Center, LeeVanSchaick said.
Lower load levels and gas prices led to lower transmission congestion and uplift.
Mapping Congestion
The report featured a new system congestion map, which LeeVanSchaick said offers a truer representation of congestion patterns.
“Where there’s a generator, it shows you what the pricing of that generator location is, but all of the load zones are shown according to the average price of the load zone on the other chart; but on this one, it’s on a gray background, and that’s helpful to distinguish between areas where there’s not a lot of generation versus areas where there may be a concentration,” he said.
Day-ahead congestion revenues totaled $62 million, down 46% from a year ago, primarily because of lower gas prices and load levels. Day-ahead congestion fell across the system, with most of the decrease occurring on the Central-East interface and in the West Zone.

New York City constraints accounted for only about 5% of congestion, which fell by nearly 80% in the city from the previous year.
Unlike most other transmission corridors, congestion from the North Zone to central New York rose by more than 100% from a year ago, and 90% of this congestion occurred on the 230-kV Moses-Adirondack MA1 line when the parallel MA2 line was out of service in most of May and June.
“We also saw wind curtailments about 8% of the time because of unusually high congestion from the north,” he said.
Day-ahead Congestion Revenues
The report included a graph of day-ahead congestion revenue shortfalls, identified by transmission corridor, with the majority coming on the West Zone lines.

To the extent that the congestion revenue shortfalls weren’t associated with Lake Erie circulation, they were generally related to outages at the Niagara plant of transformers 1, 2 and 4, as well as the Niagara-Rochester line, LeeVanSchaick said.
“Those outages will reduce how much can flow through there, so you see where that resulted in significant uplift,” he said. “We also saw in May and June very significant amounts of shortfalls coming down from northern New York, and those were associated with the outages of those Moses-Adirondack lines related to the [New York Power Authority] Smart Path Reliability Project.”


