
By Steve Huntoon
As in bridge, let’s review the bidding.
The Natural Resources Defense Council attacked PJM,1 accusing it of suppressing renewable resources relative to other RTOs, wasting billions of consumer dollars in the process and contending, in effect, that a cheap and reliable zero-carbon future could be ours if entities like PJM would just mend their evil ways.
My responding column showed that reality is different.2 PJM hasn’t obstructed renewable resources and, in fact, is outperforming its RTO brethren given the renewable cards the region was dealt. PJM’s capacity market (like other RTO capacity markets) doesn’t save uneconomic coal plants, doesn’t impose excessive costs on consumers, doesn’t suppress renewable resources and is a bulwark against bailout claims for uneconomic coal units that should retire.
NRDC ostensibly replied to my column.3 Not, mind you, to address much of what I said.
NRDC basically changed the subject. But its new claims are no more valid than the ones it made before, and its policy prescription is bigly counterproductive.
Natural Gas Plants Do the Heavy Lifting in Carbon Reduction
NRDC’s first new claim is that all retiring coal plants should be replaced with renewable resources because natural gas units won’t help reduce carbon emissions.
Specifically, NRDC says that carbon (CO2) emissions will “plateau” if coal units are replaced with natural gas units, basing this on a claim that in PJM, carbon emissions increased in 2018 relative to 2017.4
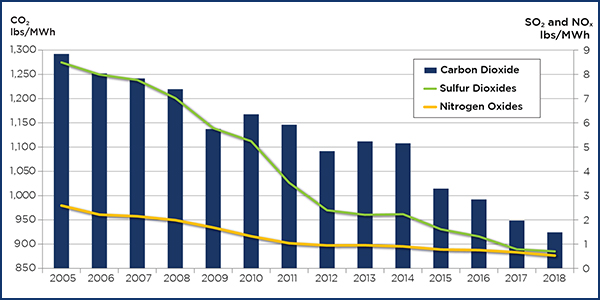
In fact, carbon emissions per megawatt-hour in PJM decreased from 948 pounds in 2017 to 925 in 2018, another decline continuing the downward trend that I discussed in my column. This downward trend is shown in the graph below.5

Let’s look at that graph for something else: the decline in carbon emissions from the advent of the capacity market until now, going from about 1,225 pounds/MWh in 2008 to about 925 pounds/MWh in 2018, a reduction of 300 pounds/MWh.
Here’s a pop quiz question: How much of that 300-pounds/MWh reduction is attributable to wind and solar generation?
- 90%
- 50%
- 10%
The answer is c, only 10% of the reduction is attributable to wind and solar generation.6 The reality is that new natural gas plants, and higher dispatch of gas plants generally, are responsible for 90% of the carbon-emission reduction in PJM.
This reality makes perfect sense. Remember that we’re not replacing average coal units with average natural gas units; we’re replacing old, inefficient coal units with new, efficient natural gas units. So it’s not just the rule-of-thumb 50% reduction in carbon; it’s more like a 65% reduction in carbon, along with a staggering 97% reduction in nitrogen oxides (NOx) and a 99.8% reduction in sulfur dioxide (SO2).7
Natural gas plants do the heavy lifting.
The PJM Capacity Market Works to Reduce Carbon Emissions
NRDC’s second new claim is that the PJM capacity market is flawed because the RTO could procure the targeted level of resources at a much lower price than it does.
NRDC gives a graphic example with a hypothetical clearing price of about $60/MW-day at the target reserve margin. NRDC’s example has the fatal flaw of its supply curve not actually intersecting the demand curve at that price.8
So it’s not a clearing price at all. ECON 101: Clearing price is where the supply and demand curves intersect. NRDC creates a fantasy.
In practical terms, NRDC is saying that PJM should procure the target reserve margin for about $60/MW-day — when the cost of new entry is about $300/MW-day.9
Under NRDC’s approach, new entrants would never recover the CONE. They will know that. Ergo, no new entry.
The inefficient old coal units would no longer be forced out by new, efficient natural gas plants. The coal plants hang on and continue polluting. Except for the small contribution from renewables discussed above, PJM’s downtrend trend in carbon (and other pollutants) would come to an end.
Does that sound good to you?
2- https://rtoinsider.com/counterflow-scary-wrong-139476/.
3- https://rtoinsider.com/pjm-market-design-hurting-clean-energy-140043/.
4- NRDC claims “carbon pollution in the region (and nationwide) increased year over year in 2018.” This is true (barely), but only in a literal sense because of an overall increase in PJM generation in 2018 relative to 2017.
6- Wind and solar generation accounted for 2.8% of total PJM generation in 2018, http://www.monitoringanalytics.com/reports/PJM_State_of_the_Market/2018/2018-som-pjm-sec8.pdf (page 356). So without that 2.8%, the 925-pounds/MWh emission rate in 2018 would have been about 950 pounds/MWh, which would have been a reduction of 275 pounds/MWh from the 2008 level. So wind and solar are responsible for a 25-pounds/MWh reduction, and natural gas plants — new plants and higher dispatch generally — are responsible for a 275-pounds/MWh reduction.
7- Using the Energy Information Administration’s eGRID data available here, https://www.epa.gov/sites/production/files/2018-02/egrid2016_data.xlsx (PLNT16 tab, columns PLCO2RTA, PLNOXRTA, PLSO2RTA), for a sample of five new natural gas plants (Newark, Woodbridge, Panda Liberty, Panda Patriot and Brunswick County) and five recently retired coal plants (Will County, Conesville, J.M. Stuart, Miami Fort and Bruce Mansfield).
8- Please note that what NRDC calls “Huntoon’s Alternative Supply Curve” actually does intersect with the demand curve, at a clearing price of about $300/MW-day.
9- The estimated net cost of new entry for the overall PJM region was about $320/MW-day in the last capacity auction. Estimated net CONE in the next auction is about $260/MW-day. Competitive markets continue to drive down costs.


