By Robert Mullin
A new research report indicates that the belly of CAISO’s “duck curve” is deepening more quickly than originally expected, with its effects increasingly spread across the year — and not just on the typical spring day depicted by the graph.
The report from consulting firm ScottMadden also suggests that distributed energy resources such as rooftop solar are contributing only modestly to the decline in net load and ramping rates associated with the widespread adoption of solar energy in California.

“The duck curve is driven by utility-scale solar in California, not distributed resources,” the report says.
The report’s authors contend that understanding the root causes and impact of the curve is necessary for responding appropriately to its effect on grid operations.
“If we are to effectively address renewable integration challenges, it is imperative that we understand and address the actual issues that exist,” the report says. “Solutions for a seasonal, weekend, utility-scale solar issue may well be different than solutions for an everyday, distributed resource issue.”
California’s duck curve first appeared in 2013, the product of CAISO’s effort to forecast the long-term impact of increased renewable penetration on its daily operations.
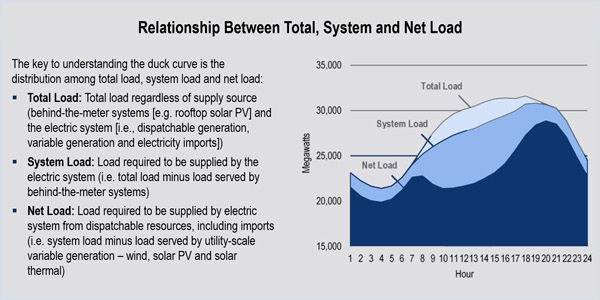
That forecast demonstrated how the adoption of solar and other renewable resources would steadily undercut the ISO’s “net load,” which represents the portion of load that must be served by dispatchable resources such as gas-fired generation and imports. The net load calculation looks at total load for a given interval and subtracts energy generated by variable renewable resources.
Load Declines not Limited to Spring
The duck-shaped curve illustrates how daytime solar output crowds out the need for dispatchable resources during much of the day. That, in turn, creates the need for the sharp ramping of dispatchable resources as the sun begins to set. Over the long term, that ramp is expected to grow steeper as more solar resources come online and further depress net load as the state seeks to meet a 50% renewable energy mandate.
While CAISO’s original duck curve forecast predicted that minimum net load would fall to about 15,000 MW in 2016, this past spring already saw that figure — represented by the curve’s trough — sink to a low of 13,894 MW, a 31% decline from 2011. (See Solar is the Generation of Choice in California.)
Since 2011, ScottMadden said, CAISO’s daytime minimum net loads have been declining throughout the year, not just during the spring periods characterized by low residential loads coupled with relatively high solar generation. Furthermore, steep ramps are becoming more frequent, with the late-day three-hour ramp exceeding 5,000 MW on 58% of days in 2015, compared with 6% in 2011. Last year’s steepest ramp was 10,091 MW, a 62% increase from four years earlier, the report shows.
And the most significant ramps are occurring in fall and winter, when California’s net loads are at their lowest. In 2015, the 20 steepest ramps occurred in December (10), November (eight) and January (two).
The firm’s analysts also determined that the sharpest ramps consistently occur on weekends, the low point for weekly loads. Weekend ramps average 10% higher than those occurring on weekdays.
Weekends More Prone to Impacts
“These results suggest that weekends are more prone to experience the impacts of the duck curve because of their lower system loads,” the report says. “Conversely, higher system loads on weekdays mitigate the midday decline in net load and the impact of the duck curve.”
Perhaps most important from a system planning perspective, the report attempts to dispel the notion that DER is contributing significantly to the shape of the duck curve.
The authors explain that, while behind-the-meter distributed resources and energy efficiency appear to be offsetting growth in California’s total load, together they have little impact on the shape of the daily curve of system load — or load that must be supplied by system resources.
The authors back this claim by comparing CAISO — where distributed resources are just 3% of utility-scale capacity and do not participate in the wholesale market — with Hawaii, where residential solar represents 9% of generation managed by the state’s largest utility. In California, daytime system load has changed little since 2011, while Hawaii has seen a sharp decline over the same period.
Based on those findings, grid solutions need not “be totally dependent on complex DER management,” the report contends.
“Instead, the operational challenges associated with utility-scale solar present the potential for more targeted utility-scale solutions,” the report says.