
NYISO energy markets performed competitively in the first quarter of 2021, and energy prices rose 40% to 143%, primarily because of higher gas prices, the ISO’s Market Monitor reported.
All-in prices ranged from $22 to $69/MWh, up from the very low values observed in the first quarter of 2020, but “consistent with prices we saw in quarters before last year,” Market Monitor Pallas LeeVanSchaick of Potomac Economics told the Installed Capacity/Market Issues Working Group Wednesday in presenting the State of the Market report for the first quarter.
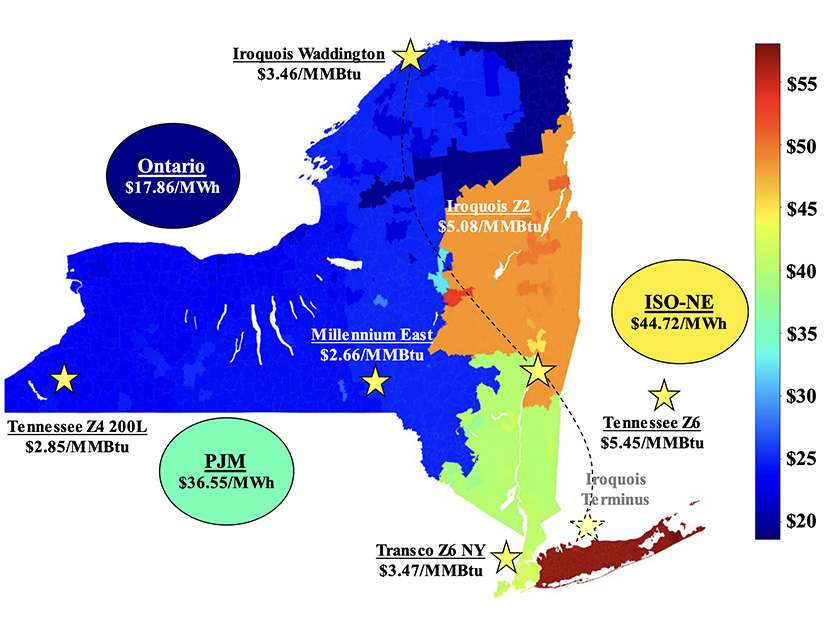
Congestion increased because of larger gas price differences between regions and lengthy transmission outages along the Central-East interface and into Long Island.
“We saw capacity prices rose significantly in New York City as a result of the higher locational capacity requirement (LCR),” LeeVanSchaick said. Prices also increased outside the city “but were still quite low.”
Oil-fired generation rose notably from late January to mid-February as gas prices in East NY rose to the oil price level because of cold weather conditions. However, the weather was not severe enough to put significant strain on the gas supply and oil inventories.
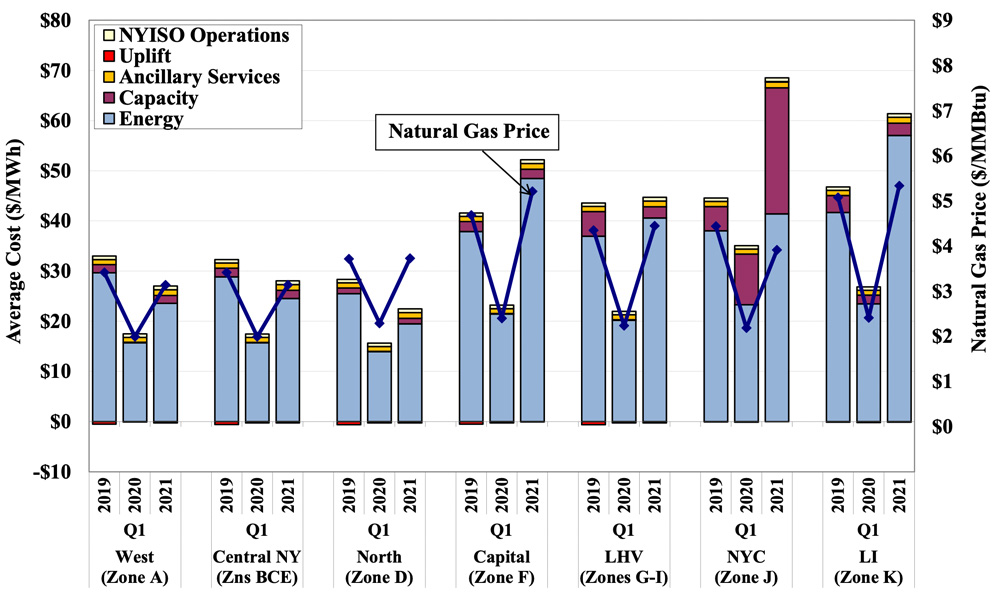
Spot capacity prices averaged $0.61/kW-month in Long Island, the G-J Locality and Rest of State, and $8.68/kW-month in New York City in the quarter.
The rest-of-state prices rose sharply in percentage terms, but prices were very low in 2020-Q1. The price rose primarily because of supply offer changes. The spot price rose substantially from $0.06/kW-month in January to $0.89/kW-month in February and March, with unsold capacity rising to ~580 MW.
Reliability commitments rose modestly in NYC because of higher load and more transmission outages, leading to higher bid production cost guarantee (BPCG) uplift. But LeeVanSchaick said NYISO and Con Edison have made procedural changes for N-1-1-0 requirements in the city in recent years, which have improved the efficiency of these commitments and reduced uplift.
“They have reduced the incidence of commitments that were not necessary for reliability,” he said. “For example, previously, we had seen instances where they committed a unit for 24 hours when it was only needed for two or three hours.”
Emission Signals
Nuclear and hydro generation fell by an average of 1 GW collectively from a year ago, reflecting the retirement of Indian Point 2 and more frequent freezing conditions. Consequently, gas-fired generation rose by more than 7% despite higher natural gas prices.
Gas-fired steam turbine generation rose by 660 MW on average. Most of the increase occurred on Long Island, where steam turbines were used more often during lengthy transmission outages to serve load, satisfy reserve needs, and support contractual requirements to export to New York City.
However, gas-fired combined cycle generation fell by 250 MW in the Hudson Valley. Increased gas pipeline constraints limited production from gas-fired units in the region during many cold days in the quarter.
Oil-fired generation on Long Island rose significantly on many days in January and February as cold weather drove gas prices to the level of oil prices.
These changes led to increased CO2, SO2 and NOx emissions from the same period a year ago, despite the retirement of coal generation in 2020. Long Island accounted for most of the increases in emissions, which are an anomaly from long-term trends and show how difficult it will be going forward to achieve incremental reductions in emissions from power generation, LeeVanSchaick said.
Congestion Patterns
Day-ahead congestion revenues totaled $179 million, up 222% from the first quarter of 2020. The increase was driven by higher gas prices, especially in February, and lengthy transmission outages along the Central-East interface and into Long Island.
The Central-East interface accounted for the largest share (77%) of day-ahead congestion revenues in the first quarter of 2021.
Long Island accounted for 7% of congestion, primarily on 345-kV paths from upstate to Long Island because of lengthy transmission outages. NYC congestion was relatively low, accounting for only 5% of total congestion in the first quarter of 2021.
NYC congestion has been relatively low in recent years since generation there has become more economic because of lower Transco Zone 6 NY gas prices relative to gas prices in other parts of East NY.
NYISO has greatly reduced the use of out-of-market (OOM) actions to manage low-voltage transmission constraints in the past two years by modeling most 115-kV constraints in the day-ahead and real-time market models, he said. OOM actions to manage lower-voltage network congestion were most frequent in the North Zone (13 days) and Long Island (10 days) this quarter.
Oil-fired peakers were dispatched out-of-market on eight days for 69-kV constraints in Long Island. NYISO began to represent certain 69-kV constraints on Long Island in the market models in mid-April 2021, which should improve the efficiency of congestion management and investment incentives.
Reliability commitments in NYC accounted for roughly 84% of all reliability commitments in the quarter and rose 19% from a year ago. The increase reflected higher load levels and more transmission outages in the 345-kV system and around the Freshkills load pocket.
Nonetheless, NYISO and Con Ed have implemented several procedural changes for N-1-1-0 reliability commitment in NYC load pockets in recent years.
For instance, since January 2021, NYC load pocket requirements assume the use of 300-hour ratings rather than normal transfer limits after the second contingency, which have improved the efficiency of these commitments and lowered the associated uplift.
Performance Test
NYISO routinely audits 10- and 30-minute non-synchronous reserve providers to ensure that they can provide the services that they sell. However, units that perform well during audits may still perform poorly during normal market operations, and it may be appropriate to suspend or disqualify poor performers, LeeVanSchaick said.
Using performance during reserve pick-ups or economic starts in lieu of audits would reduce out-of-market actions and uplift costs (~$105K of uplift in 2021-Q1), LeeVanSchaick said.