Solar has overtaken wind in the interconnection queues of MISO and SPP as the declining costs of photovoltaic panels have made it more profitable even in the cloudier, windier areas of the U.S.
Panelists from the two organized markets discussed the trend with RTO Insider Editor and Co-Publisher Rich Heidorn Jr. in a panel called “Value of Solar: U.S. Roadtrip” at the Energy Storage North America-Intersolar North America annual summit Wednesday.

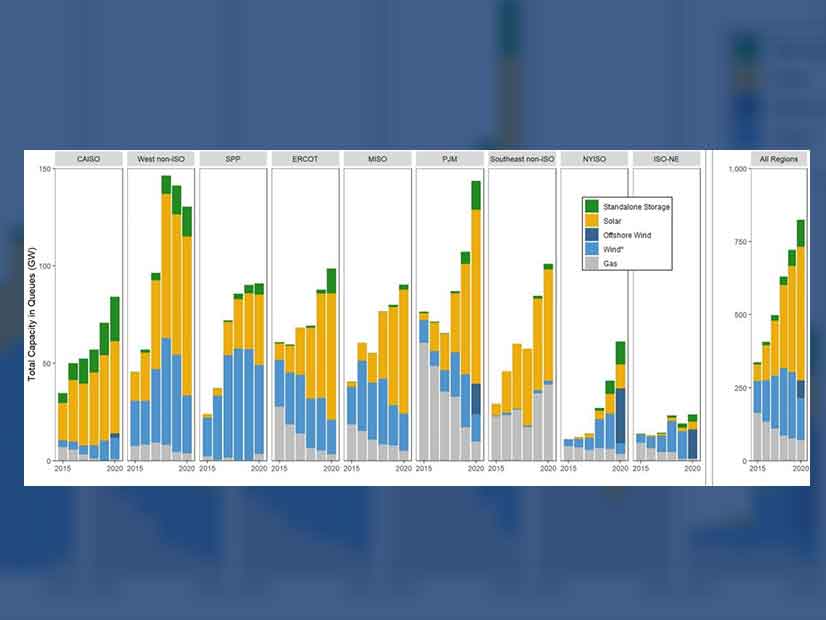
“What we’re seeing from an interconnection standpoint — facilities or developers requesting connection to the MISO system — is [that] of the 80 GW of overall capacity that’s seeking interconnection, 65% of that is solar right now,” said Jordan Bakke, director of policy studies with MISO. “There’s been a big growth in the amount of solar resources seeking interconnection to the system.
“That’s in comparison to the predominant wind growth that we’ve seen in the past,” Bakke said. “It’s really changed over in the last few years to be solar-dominated facilities seeking interconnection, and I think we expect that to continue going forward, at least for the time being, given the cost declines and tax treatment that the facilities see.”
Solar is spread relatively evenly over the MISO footprint, which stretches from the Canadian border to the Gulf of Mexico, with about 5% fewer arrays in the north than in the south, he said.
“We’re seeing that interconnection take place everywhere,” Bakke said. “Places that aren’t windy are building solar, and places that are windy are also building solar to help complement that resource.”

SPP Director of System Planning Casey Cathey described a similar phenomenon in his RTO’s territory, which ranges from North Dakota to northern Louisiana. SPP is known for setting records for wind installations, with 13,000 turbines producing 26 GW. Now it is surging ahead with solar, he said.
“This year is the first year that we’ve actually seen the solar in the queue higher than … wind in our queue,” Cathey said.
SPP only has about 250 MW of solar installed and operational, but it has 35 GW of solar in its queue, he said.
About “500 MW of that is ready to go, and so the way we see it is solar and energy storage is really the next frontier for SPP,” Cathey said.
Solar is disbursed relatively evenly across SPP’s states even though irradiance levels are highest in New Mexico and the Texas Panhandle, “but we’re actually seeing valuable business cases for solar installs as well as hybrid solar-battery installs peppered across the SPP footprint,” he said.
Casey described the change as an “explosion” of solar in SPP territory.
“It’s really been a dramatic shift,” Heidorn responded.
Utility-scale solar has grown ninefold since 2013, when total capacity was around 4 GW; it is now about 38 GW, according to research by Lawrence Berkeley National Laboratory. With photovoltaic prices continuously declining, utility-scale solar represented about 73% of all new capacity added in 2020 and accounted for 63% of cumulative solar capacity by the end of last year, the lab found.
It was the second largest source of capacity additions in 2018 around 23%, with natural gas first at 55%.
That changed in 2020, said Joachim Seel, a senior scientific engineering associate in the Electricity Markets and Policy Department at the lab.

Joachim Seel, Lawrence Berkeley National Laboratory | Energy Storage North America
That changed in 2020, said panelist Joachim Seel, a senior scientific engineering associate at the Electricity Markets and Policy Department at the Lawrence Berkeley National Laboratory.
Last year “was just a terrific year for solar additions,” Seel said. Florida and Texas for the first time have overtaken California in solar additions, he said.
“There has just been this interesting trend over many years now,” as solar has spread from California, Arizona and other Southwest sunbelt states to the Great Plains, Midwest and the Southeast, he said.
State clean energy requirements and the market competitiveness of solar has driven large installations, many over 100 MW, he said.
“With the declining cost of PV, it has just become more attractive and economical in many other parts of the country,” Seel said. “And so in in recent years, we’ve seen especially strong growth among the regulated utilities in the Southeast … [Florida Power & Light] being a great leader there.”