On two mild, sunny days in New England last week, energy demand was at its lowest in the middle of the day, when the thousands of megawatts of mostly behind-the-meter solar installations in the region were at their most effective.
It’s the latest example of the phenomenon first noticed in California and known as the “duck curve,” named after the duck-shaped pattern that occurs from charting power demand and the availability of solar.
Increasingly common “duck sightings” in New England are a signifier of the growth of solar in the region that doesn’t show any signs of slowing down.
On Feb. 11, load dipped to 11,207 MW at 12:55 p.m., according to ISO-NE. LMPs were negative for some of the mid-day period on Friday, hitting a low of $-63.83. Two days earlier, load had hit a low for the day of 11,890 MW at 12:30 p.m.
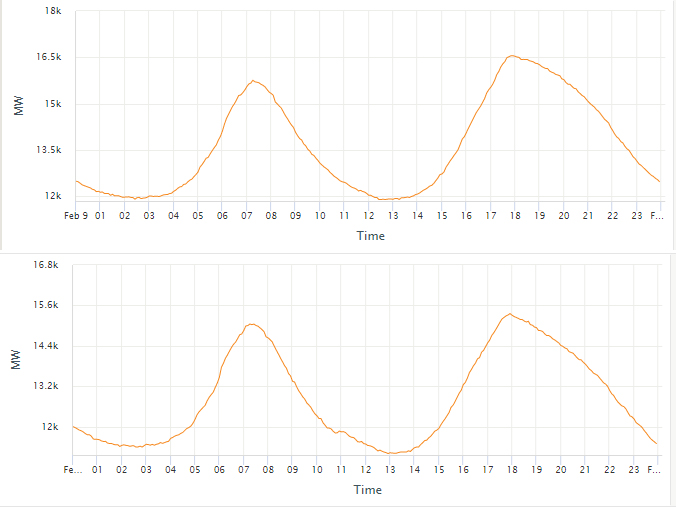 Midday load in New England dropped below overnight load on Feb. 9, above, and Feb. 11. | ISO-NE
New England has seen more of these mid-day minimum load days each year since 2018, when it first occurred, according to ISO-NE data. 2019 saw three such days, with 13 in 2020 and 18 in 2021. This year has seen three so far, marking the first time the phenomenon has occurred so early.
The duck curve and solar’s intermittent nature have been known to bring operational challenges to other regions. Grid operators have to quickly ramp up dispatchable resources when the sun goes down and solar output falls, and they might have to curtail solar generation in the case of excess capacity. ISO-NE launched an enhanced real-time fast-start pricing feature in 2017 to try to incentivize resources that can quickly ramp up their output to help address the sharp rise in demand when the sun sets.
ISO-NE spokesperson Ellen Foley said in an email to RTO Insider that the existence of duck curves is notable, but it “doesn’t really define how the system is operated.” The grid operator optimizes commitment and dispatch using the day-ahead market; it then develops an operating plan and manages the power system based on that plan, she said.
Solar Boom
Because of the distributed nature and less predictable qualities of solar, it’s tricky to forecast on a day-to-day basis.
“Forecasting that [load] reduction continues to be a challenge for the ISO; going into the day, we could be forecasting high production from solar PV, only to see more cloud cover or snow lingering longer than expected, which results in the ISO using more traditional generators to replace that energy. Therefore, we are continuously working on updating and improving our PV forecasts,” Foley said.
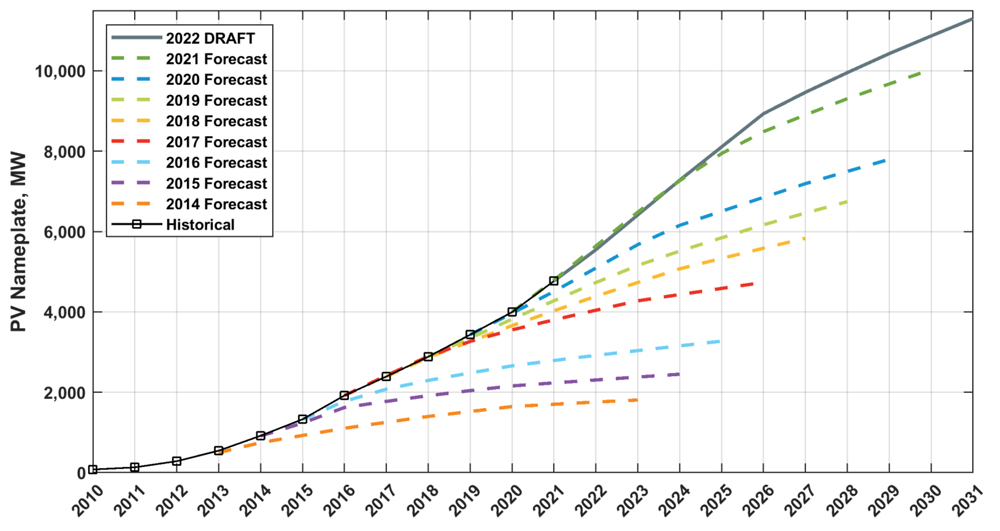 Solar growth in New England has repeatedly outpaced forecasts. | ISO-NE
But its long-term projections, based on historical trends and state policy, show that solar production will continue to be an increasingly significant presence in New England over the next decade.
ISO-NE’s latest draft forecast of solar development, published on Monday, estimates 11,298 MW of solar generation in the region by the end of 2031, nearly 2.5 times the 4,767 MW installed in New England at the end of 2021.
The RTO’s changing forecast itself is another sign of the rapid solar ramp-up, with this year’s projections for 2030 more than 830 MW above the 2021 forecast.
Massachusetts remains the driver of solar growth in the region, with more than two-thirds of New England’s installed capacity in the Bay State.