PORTLAND, Ore. — When energy economist Robert McCullough greeted this reporter at a wine shop and deli in our shared Southeast Portland neighborhood, he joked about recently contributing to “quite a stir” in the electricity industry.
McCullough was referring to a high-profile article published in The New York Times Jan. 4 under the headline “Why Are Energy Prices So High? Some Experts Blame Deregulation,” which set off a wave of criticism from industry insiders — much of it on #energytwitter.
“On average, residents living in a deregulated market pay $40 more per month for electricity than those in the states that let individual utilities control most or all parts of the grid. Deregulated areas have had higher prices as far back as 1998,” the Times said.
Times Article Misses the Mark, Critics Say
Critics faulted the Times for conflating “deregulation” with organized RTO/ISO wholesale markets.
While 13 states and the District of Columbia allow most of their electric customers to choose their electric supplier, the Times appeared to be including as “deregulated” 21 states whose utilities participate in organized wholesale markets but do not allow retail choice, said R Street Institute energy adviser Josiah Neeley in a rebuttal published in Reason.
The Times “seems to say that the label ‘deregulation’ applies even in places like Minnesota, where no customer exercises a choice in provider, and where the industry simply has been restructured to be part of a larger grid with two different regulators (FERC and the state),” tweeted former Montana regulator Travis Kavulla.
Kavulla, now vice president of regulatory affairs for NRG Energy (NYSE:NRG) also rejected the characterization of California as “deregulated,” saying it “stands as the foremost example of a jurisdiction where policymakers treat utility balance sheets as playthings for various policy ends.
“There is no such thing as ‘deregulation’ or a ‘free market’ in this industry anywhere — which remains regulated everywhere,” Kavulla added.
A power and gas trader who tweets under the name “King of Power” called the piece a “master class in how not to do power market analysis,” adding that “the article is so full of bad methodology and blatant falsehoods that it would make a utility blush.”
Other critics pointed to a lack of supporting data in the piece.
McCullough, who was prominently quoted by Times reporter Ivan Penn, also produced the data that was cited in the article but conspicuously absent from it. In an interview with RTO Insider, McCullough acknowledged that omission, but said he thought the piece was “generally a good article” that just required more “column inches” to do the subject justice. He said he may have “overwhelmed” Penn “on this whole question of competition.”
“Of course, one of the evocative things about electricity — evocative in that it attracts a lot of confusion — is it is complicated, and so it’s very hard to get some of the concepts across,” McCullough said.
Penn did not respond to a request for comment.
Some of that confusion may have stemmed from the article’s use of the term “deregulated.” In our interview, McCullough said the analysis he provided the Times wasn’t really a comparison of retail electricity prices in deregulated versus regulated states, but between states operating inside and outside of organized markets.
McCullough’s staff sourced the price and volume data from the U.S. Energy Information Administration’s Electric Power Monthly reports, and calculated weighted price averages to show differentials between RTO and non-RTO states.
“Is that exact? No, because of course, some of the states are split between two [markets]. But was it honest? Yeah — it’s a pretty straightforward calculation,” McCullough said.
The data does not control for differences in fuel costs or resources across regions, because, McCullough said, the Times only requested retail price numbers. A spreadsheet he provided to RTO Insider includes a retail price data series covering January 1998 to October 2022, showing average monthly prices and total electricity consumption by state. That data is then distilled into a comparison of prices between RTO and non-RTO states over the entire period.
The first entry, January 1998, before widespread implementation of retail choice, shows an average retail price of 6.33 cents/kWh in non-RTO states and 7.41 cents/kWh for states that would eventually join RTO states. During the Western energy crisis in 2001, the spread increased sharply, with non-RTO states averaging of 6.47 cents/kWh and RTO states 9.35 cents/kWh.
During a period of relatively high natural gas prices from 2002 to 2009, retail prices averaged 8.35 cents/kWh in non-RTO states versus 9.99 cents/kWh in RTOs. In the 2012-15 period of lower gas prices, average non-RTO and RTO state prices were 9.52 and 10.47 cents/kWh, respectively.
A graph included with the data illustrates trends across the time series, with callouts for events in which RTO price spikes outpaced those in non-RTO areas. The events include the commodities price bubble of 2008, the ERCOT outages accompanying February 2021’s winter storm and Russia’s invasion of Ukraine in February 2022.
McCullough contends that prices in RTO areas can be more sensitive to such events because RTOs rely on the single market clearing price mechanism to set prices, as opposed to the “price-as-bid” nature of the traditional utility model.
“For states served at the market clearing price — ERCOT comes to mind — the swings are greater because the entire market is priced at the market clearing price,” he said. “And, of course, for ERCOT the reserve margin price adjustment, as well as the ERCOT-administered emergency price cap, creates quite a ‘bump.’ A peculiarity of the ERCOT rolling outages is that the prices crossed the ERCOT border and extended all the way north to North Dakota in the SPP market. This is somewhat peculiar given the limited transmission, but [it] did affect retail rates.”
McCullough was among the first industry watchers to identify the manipulation that sparked the Western energy crisis of 2000-01, when energy traders such as Enron exploited adverse market conditions and design flaws in California’s organized electricity market to drive up wholesale prices. Their actions caused rolling blackouts, bankrupted Pacific Gas & Electric and nearly sunk Southern California Edison. He has long been a vocal critic of RTOs and ISOs, which he refers to as “administered” markets, compared with what he calls the “competitive” bilateral wholesale markets that still predominate in most of the West.
“Northwest power markets are large and competitive and low-price, but we don’t have a central administrator to tell us what to do. How valuable is the central administrator on energy markets and prescheduled energy markets? I suspect the answer is: pretty irrelevant,” he said.
McCullough thinks the Northwest has “maintained a very successful, large, efficient market for many years … with very few abuses, no blackouts, [and] guys who actually call each other on the phone and buy and sell.
“Exceedingly transparent. Far more transparent than in the California ISO because you know everyone’s prices every day,” he said.
Impact of Markups
R Street’s Neeley also challenged the Times’ contention that competition leads to higher prices because of “profits taken in by energy suppliers.”
“Based on reading the Times article, you might be surprised to learn that monopoly utilities also make profits,” Neeley wrote. “Indeed, utility rates are typically set to give the utility a set percentage of profit based on their past investments. This, needless to say, does not encourage utilities to find ways to lower costs.”
The Times article might have strengthened its thesis if it gave more than passing mention to a Harvard working paper published last month that does in fact focus on the impact of electricity deregulation on ratepayers.
The authors of the paper, Alexander MacKay, assistant professor of business administration at Harvard Business School, and Ignacia Mercadal, assistant professor of economics at University of Florida, say their work seeks to fill a gap in the academic discussion on electricity restructuring by addressing the question of whether deregulation of wholesale (as opposed to retail) markets has resulted in lower electricity prices for end consumers.
Their findings suggest the opposite: that consumers in markets subject to wholesale deregulation have seen greater increases in retail prices compared with those in fully regulated environments.
“The goal of our analysis is to evaluate the effect of electricity restructuring on markups and prices. For this, we compare utilities in restructured states to those that remained vertically integrated and regulated, and we examine the evolution of costs, wholesale prices, and retail prices over time,” MacKay and Mercadal explain in the paper.
While the study does not specifically focus on differentials based on RTO markets, it does address the influence of those markets on price outcomes, in part because nearly every retail choice state featured in the study — except Oregon — participates in an RTO or ISO. That study also relies on EIA retail price data sets.
The study examines the period between 1994 and 2016, using 1999 as the “baseline” for retail prices and relying on a “difference-in-differences” approach that measures the price movements in deregulated states relative to the those in the “control” group of states that did not implement retail choice. It finds that states that unbundled their monopoly utilities started with a higher baseline for retail prices (averaging $79/MWh — or 7.9 cents/kWh) than those in the control group ($59/MWh), which is attributed to higher fuel prices in the deregulated states at the time.
From 1994 to 1997, the analysis showed prices were stable for both groups, followed by a convergence over 1998-2000 as prices in deregulated states declined while those in control states held steady. “Starting in 2001, prices in both states began to rise. Deregulated prices outpaced control prices until 2005, when the gap between the two widened further,” the authors write.
From 2000 to 2005, deregulated utilities saw average price increases of $3.90/MWh, followed by a sharper rise of $12.60/MWh from 2006 to 2016 (a 16% increase from the baseline), for an average increase of $7.60/MWh over 2000-2016.
“We reiterate that these changes are difference-in-differences effects, i.e., increases above and beyond the price trends occurring in control utilities,” the authors wrote.
Another key finding: while retail prices rose in deregulated markets, generation costs declined, with average fuel prices falling by $6.90/MWh over the study period. The authors say that indicates generators were earning higher “markups” for their power — the difference between the selling price for power and the cost for generating it. The study finds that markups were “modest” from 2000 to 2005, but spiked to $20/MWh over 2006-2011 (See graph).
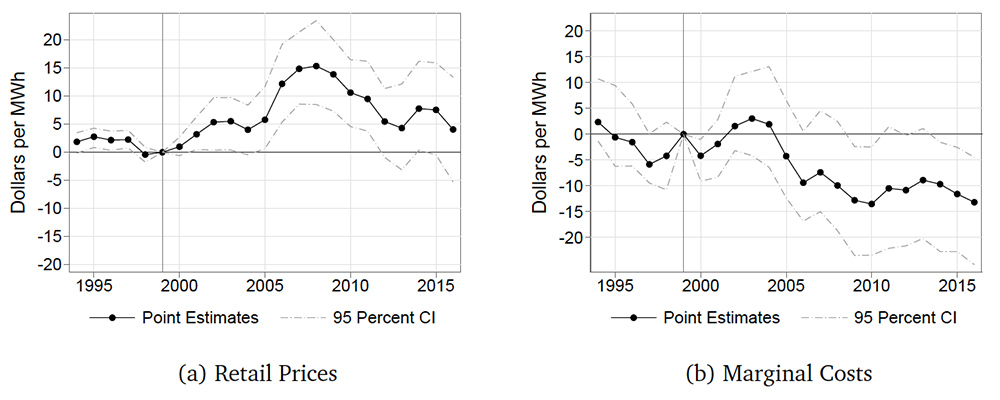 Figure displays difference-in-differences matching estimates of changes in (a) retail prices and (b) fuel costs for deregulated utilities. Each deregulated utility is matched to a set of three control utilities based on 1994 characteristics. The estimated effects are indexed to 1999, which is the year prior to the first substantial deregulation measures. The dashed lines indicate 95 confidence intervals, which are constructed via subsampling. | Alexander MacKay and Ignacia Mercadal
MacKay and Mercadal attribute that development to a combination of factors present in deregulated markets, including an increased concentration of power suppliers and a larger pool of buyers that now includes utilities, power marketers and industrial customers. They contend that when the wholesale price caps that states implemented to smooth the transition to deregulation began to expire around 2005, bargaining power for distribution utilities declined while the market power of generators increased.
“For a utility, obtaining electricity from the wholesale market was more expensive than [providing its own generation], as wholesale prices reflect a markup. … With deregulation, utilities effectively paid a market-based markup to generation facilities that they had previously owned,” they say.
At the same time, incumbent utilities increased their regulated retail rates to reimburse average variable costs, which “went up due to the introduction of this markup.”
The study also contends that the specific characteristics of electricity make wholesale markets “particularly prone to market power.”
“Both demand and supply are inelastic, yet supply must meet demand at every moment since large amounts of electricity cannot be stored efficiently. Transportation is expensive, constraining the degree to which generators compete across local markets. Entry is limited due to large sunk investments, long planning horizons, and high risk. As a result of these factors, only a few generators are typically competing to serve demand for a certain area at a particular moment, and the relative scarcity can give them substantial market power. Deregulation did not fundamentally change these factors,” the authors say.
Tyson Slocum, director of Public Citizen’s energy program, said the Harvard study indicates that the efficiency gains from wholesale markets “are all being vacuumed up by these sophisticated traders and other market participants” who exploit arbitrages and take the profits, leaving no savings to end consumers.
“It’s a who’s who of sophisticated financial traders,” Slocum said. “Those guys are parked in those markets, not because, you know, ‘Gosh, we need to work every day to deliver value to end users.’ They’re like: ‘We’re going to be heavily in these markets to exploit the arbitrage and make enormous and unregulated profits.’ That’s what’s driving RTO activity.”
‘Likely Wrong’
But criticism of the study came from a different corner, setting off an exchange that illustrates the difficulty of reaching consensus on the impacts of electric restructuring.
Scott Harvey, an energy consultant with FTI Consulting and member of CAISO’s Market Surveillance Committee, picked apart the paper in an email to RTO Insider. Among other complaints, Harvey contended that its finding of declining fuel costs for generators from 2002 to 2015 was “incomprehensible” and that there must be something “fundamentally flawed” in how those costs were measured.
He also argued that the wholesale electricity prices used in the paper do not reflect prices in the spot markets, but the higher prices since 1994 for various types of contracts, including those for securing renewables to meet state environmental mandates.
“Hence the fuel cost measure is wrong and the wholesale price measure is wrong. All of the results in the paper are likely wrong,” Harvey wrote.
MacKay and Mercadal defended their approach for measuring fuel costs and noted that their analysis checked for variables such as environmental regulations.
Mercadal also said it would’ve been incorrect to just focus on spot prices in their analysis.
“A big point of our paper is that most of the purchased electricity (>80%) comes from contracts (not spot markets), and these prices are indeed often higher. We can’t just ignore these prices … they really do matter for the prices that consumers pay!” she wrote.
“We would be happy to see evidence supporting other explanations for our findings. We tried competing hypotheses but were not supported by the data,” Mercadal said.