The Lawrence Berkeley National Laboratory on Tuesday released updated data showing that the savings for new electric transmission lines were higher last year than at any point in the last decade.
“Generally high electricity prices coupled with extreme weather events and other factors helped drive the high value for transmission,” LBNL said in a fact sheet on its findings.
The lab looked at congestion values and found that building major new lines between important power trading hubs would lead to significant savings. Congestion is correlated with the national average of wholesale electricity prices.
“Extreme conditions and high-value periods have an outsized role in driving this value, though named extreme weather events oftentimes do not play as large a role as more normal but infrequent conditions, such as infrastructure outages or demand forecast misses,” LBNL said.
The report found that interregional transmission lines would offer the largest values, as most — but not all — the transmission links with a value above $200 million per 1,000 MW were interregional. Smaller regional lines had a significant valley, with many ranging from $100 million to $200 million per 1,000 MW.
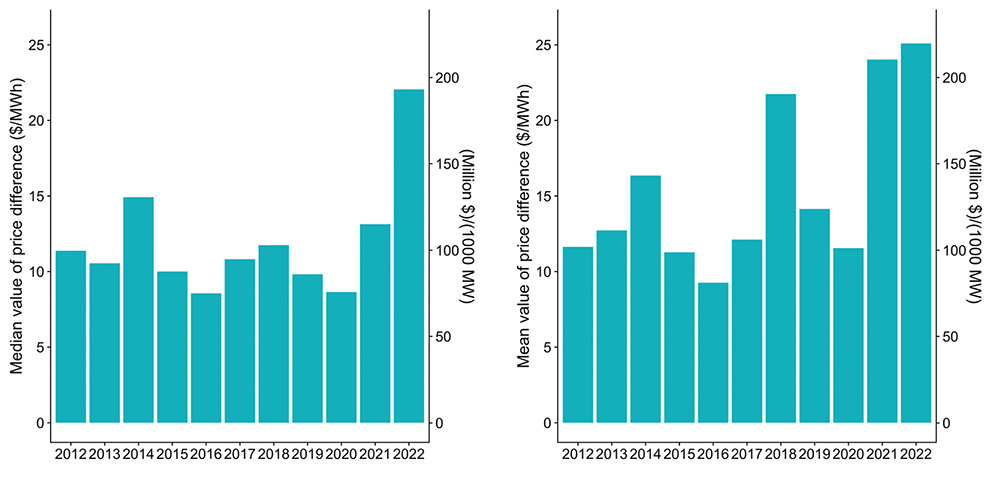 A chart showing the mean and median values of LBNL’s hypothetical lines over the past decade | Lawrence Berkeley National Laboratory
LBNL looked into 64 hypothetical transmission projects, and their mean value was $220 million per 1,000 MW, or $25/MWh, while the median value was $193 million per 1,000 MW, or $22/MWh. Both the mean and median prices were higher than earlier years that LBNL studied.
The median value was significantly higher than in any other year, which indicates that higher transmission value in 2022 was a broad phenomenon across most of the country. That suggests a national cause, such as higher power prices, were behind the rise in transmission value.
LBNL saw higher mean values in 2018 and 2021, which indicates that certain events can drive extremely high transmission value in isolated regions. ERCOT and SPP saw transmission values spike in 2021 because of the February winter storm, the report said.
Transmission’s value is tied to high demand/high-priced hours, but the higher overall prices last year made that less true than some years. Some 50% of the lines’ studied value was from just 10% of hours and 37% was from only 5% of the hours in 2022, but from 2012 to 2021, a typical transmission line derived 50% of its value from just 5% of hours.
The final week of 2022 came with another major winter storm, which showed the role of transmission in helping to manage periods of grid stress as the average transmission link derived 7% of its annual value over that week. The total annual value of transmission lines was much more tied to the winter storm in PJM, MISO and the Northeast, where the storm provided 10 to 22% of transmission lines’ values.
The report noted that if all the hypothetical lines it studied were actually built, they would have diminishing returns. Because wholesale power markets use marginal pricing, the transmission value metric LBNL calculated represents the value of the next unit of transmission.
The lines studied would be impacted by a saturation effect as additional construction brings down their value, but LBNL said that the links connect “hub” pricing nodes that represent prices over a region and might not be as sensitive to saturation effects as a more localized pocket of demand.