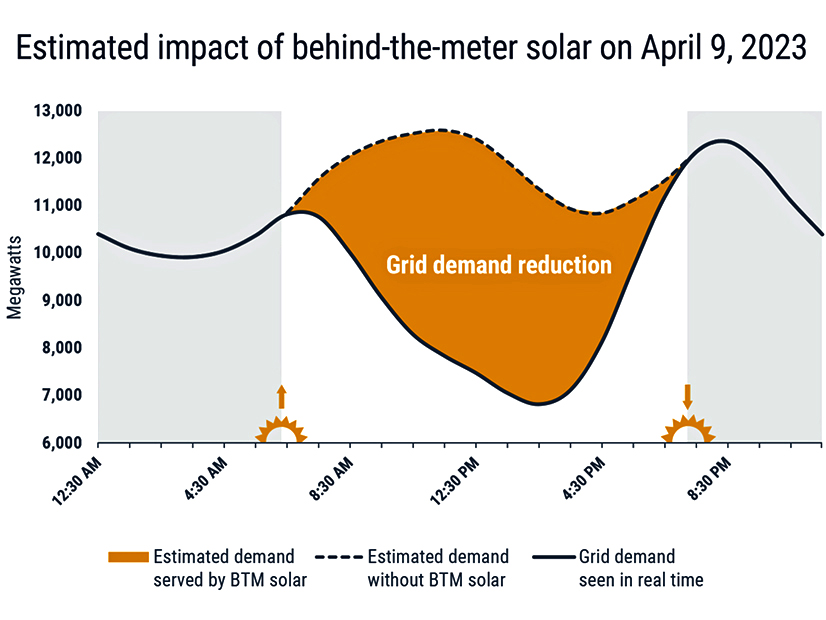
Demand on the New England regional power system fell to its lowest level in over a quarter century Sunday, thanks to the holiday, mild weather and sunshine beating down on an ever-growing number of solar panels.
ISO-NE said Tuesday that demand on the grid was the lowest it had ever recorded since the RTO began operations in 1997.
The 6,814-MW demand between 2 and 3 p.m. shattered the previous record, 7,580 MW, set May 1, 2022.
Steven Gould, ISO-NE director of operations, said the new record was not surprising.
“The evolution of New England’s power system continues,” he said in a news release. “The previous record lasted less than a year, and this one likely won’t last long either. Each day, our system operators are seeing the clean energy transition play out in real time.”
The lowest demand for electricity during the week is typically on Sunday, and Easter historically sees even lower demand than the average Sunday. Warmer temperatures on this Easter reduced demand even further. Abundant sunshine clinched the record, as behind-the-meter rooftop solar panels across the RTO’s six-state region reached an estimated peak output of more than 4,500 MW.
ISO-NE said demand rose through the predawn hours of April 9 to peak at more than 10,000 MW just after sunrise, dropped below 7,000 MW to set the record in mid-afternoon, and rebounded quickly as the sun went lower in the sky.
Demand for the day peaked at more than 12,000 MW just after sunset. This created the so-called duck curve in the flow of electricity through the grid, in which demand bottoms out in mid-afternoon rather than the overnight hours, as it usually does. The graphic representation of this phenomenon on a line chart vaguely resembles the classic rubber duck bathtub toy.
And as Gould indicated, the duck population is growing.
ISO-NE did not record its first duck curve until April 21, 2018. Through Dec. 31, 2021, it recorded 34 more duck-curve days. Then, in calendar year 2022, it recorded 45 duck curve days.
Solar power potential is at its strongest in the spring, ISO-NE noted, and 27 of the duck curve days in 2022 were in March, April and May.
Summer 2022, with its midday air conditioning demands, saw very few ducks: two in September, one in June and none in July or August.
Late autumn and early winter also see fewer ducks, as solar power generation decreases before and after the winter solstice; ISO-NE recorded only two duck curves in January 2022 and just one in December 2022.


