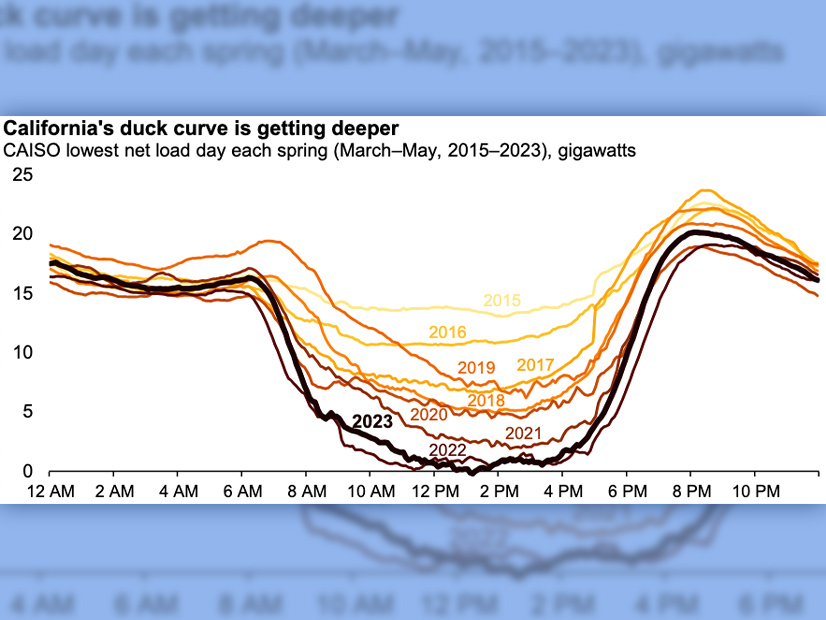
Increasing solar capacity in California pushed the belly of the state’s “duck curve” to new lows this spring, putting stress on the grid and challenging CAISO operators, the U.S. Energy Information Administration said in a post last week.
Charting the state’s net load — the demand that remains after wind and solar are subtracted — produces the duck curve. Its neck and tail represent times in the morning and evening when demand rises but solar is weak or offline. Its belly represents the middle of the day when abundant solar steeply reduces net load.
From March to May, net load hovered around zero between noon and 2 p.m. and briefly dipped into negative territory, according to an EIA chart based on CAISO data. That first happened in spring 2022, but the chart shows it occurring more this year. (See CAISO’s New Renewables Record Falls Hair Short of 100%.)
The deepening duck belly has drawbacks and benefits, EIA said.
“As more solar capacity comes online, conventional power plants are used less often during the middle of the day,” it said.
CAISO statistics show that solar power peaked on May 23 at more than 15,000 MW, exceeding a 14,000-MW peak in May 2022. (The ISO later saw a new record for solar production of 15,718 MW on June 13.)
That can stress the grid and upend traditional economics, EIA noted.
“The extreme swing in demand for electricity from conventional power plants from midday to late evenings, when energy demand is still high but solar generation has dropped off, means that conventional power plants, such as natural gas-fired plants, must quickly ramp up electricity production to meet consumer demand,” it said.
“That rapid ramp up makes it more difficult for grid operators to match grid supply (the power they are generating) with grid demand in real time,” EIA said. “In addition, if more solar power is produced than the grid can use, operators might have to curtail solar power to prevent overgeneration.”
In addition, the “dynamics of the duck curve can challenge the traditional economics of dispatchable power plants because the factors contributing to the curve reduce the amount of time a conventional power plant operates, which results in reduced energy revenues,” EIA said.
The upside is that the duck curve has “created opportunities for energy storage,” EIA said. “The large-scale deployment of energy storage systems, such as batteries, allow some solar energy generated during the day to be stored and saved for later, after the sun sets. Storing some midday solar generation flattens the duck’s curve, and dispatching the stored solar generation in the evening shortens the duck’s neck.”
California has been rapidly adding battery storage to the grid in recent years in response to evening shortfalls.
Battery storage in CAISO has grown from 0.2 GW in 2018 to 4.9 GW in April 2023, and operators plan to add another 4.5 GW in-state by the end of the year, EIA said.
California’s experience with the duck curve has been spreading to other areas, including New England, it noted. (See New England’s Duck Curve Days Chart Solar Growth.)
“In addition, a duck curve is becoming visible at the national level in the United States,” EIA said.


