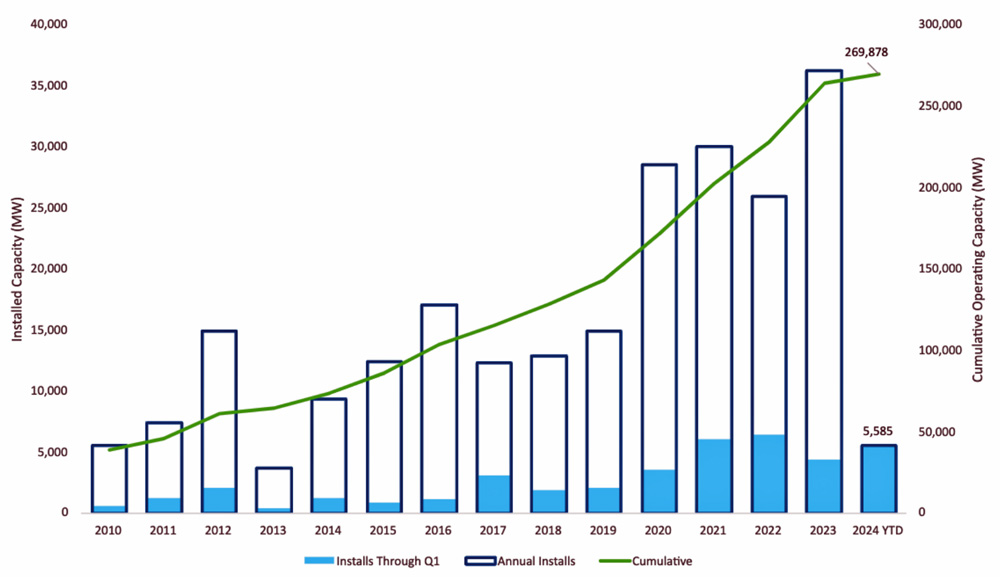
Nearly 5.6 GW of new solar, wind and storage capacity was added in the U.S. in the first quarter of 2024, the American Clean Power Association reported.
The clean energy trade group said May 7 that capacity additions in the first quarter of 2024 were 28% higher than in the same period in 2023, putting utility-scale solar power installations over the 100-GW mark for the first time. It took 18 years to reach 50 GW of installed utility-scale solar but only four years to jump from 50 to 100, noted John Hensley, ACP’s vice president of markets and policy analysis.
“Given current trends and expectations, [we expect] that the next doubling will come in a relatively short time,” he said at a news conference.
At the close of the first quarter, installed clean power capacity stood at 269.88 GW nationwide, ACP said. The pipeline of projects under construction or in advanced development nationwide reached 174 GW, up 2% from the fourth quarter of 2023 and 23% from the first quarter of 2023.
“So 2023 was already a great year, but we’re already off to an even better year here in 2024,” Hensley said. “Just to give you some sense, those 5.6 GW of projects that came online this year are about enough to power a million American homes.”
The projects ACP considers “in the pipeline” are either under construction or far along in the preconstruction process, he said. There are supply chain challenges, trade and tariff issues, and crowded interconnection queues, but “I will say that for the first time in quite a while, as we’ve looked at project delays, we’re starting to see that number slow pretty significantly,” Hensley said. “I mean, we were generally adding 10 [GW to] 15 GW of delays a quarter. We had 7 GW of delays in Q1 2024.”
As of the first quarter, ACP counts 151 GW of onshore wind, 101 GW of solar and 18 GW of storage operational nationwide.
In response to a reporter’s question, Hensley said the political situation in the U.S. introduces some uncertainty, but the industry is in a sound position: Customer demand for clean energy is increasing, technology costs are easing, and the economic benefits are spread across red and blue states.
“It may be kind of strange to concede that 80-plus percent of our projects are actually taking place in more conservative parts of the country,” Hensley added.
So much of what is being built is solar, which has a lower capacity factor than wind or fossil fuel-burning generation and needs more of a backstop. Wind was first to market, about a decade ahead of large-scale solar, Hensley noted, and there has been some balancing of wind-dominant generation portfolios. ACP expects to see developer interest in wind start to rebound in 2025 and beyond.
“And again, let’s not forget about storage, we built close to 8 GW last year, another 8 to 10 this year,” Hensley added. “It’s starting to proliferate, and in more markets than just California and Texas. … We’re not quite there yet on that balanced mix, but I think that’s the direction that we see things go.”
By the Numbers
Datapoints from the report include:
-
- 4,557 MW of utility-scale solar came online in the first quarter of 2024; onshore wind and storage totaled about 450 MW each.
- 132 MW came online from South Fork Wind, the first major infusion of offshore wind in the nation.
- NextEra Energy was the leading clean-power developer in the first quarter; its 1,829 MW of solar, 449 MW of onshore wind and 50 MW of battery storage made up 41% of the national total.
- The nationwide development pipeline reached 94,462 MW of utility-scale solar in the first quarter, up from 81,509 a year earlier; 25,321 MW of onshore wind, up from 20,176; and 31,627 MW of batteries, up from 19,621.
- 66,959 MW of clean power capacity is now operational in Texas, the most of any state; California is second, at 35,002 MW, and Iowa is third, at 13,486.
- 1,964 MW of clean power came online in the first quarter in Texas, the most of any state; Florida was second, at 1,789 MW, and California was third, at 293 MW.
- Texas led the U.S. in capacity under active construction in the first quarter, with 18,950 MW; New York led in capacity in advanced development stages, at 13,850 MW, though 4,000 MW of offshore wind fell out of its pipeline early in the second quarter.
- Developers reported a cumulative 62 GW of clean power projects as “delayed” in the first quarter and expect a little less than half of that — 29.8 GW — to become operational by the end of this year.
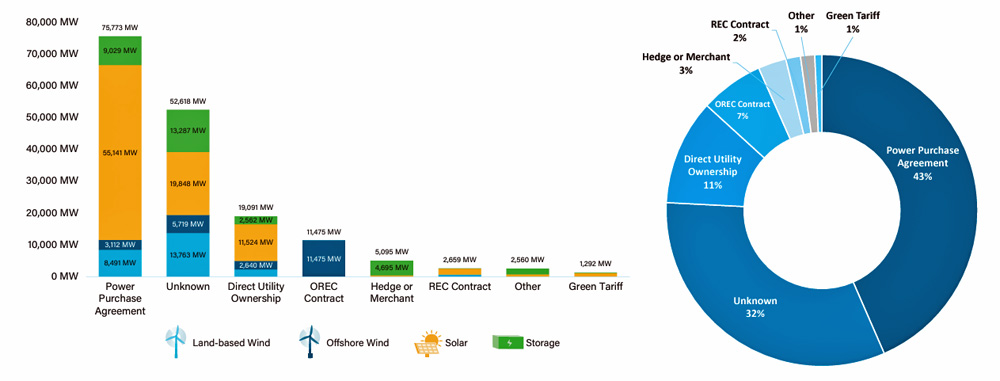
- 7,773 MW of power purchase agreements were announced in the first quarter, 52% more than in the same quarter of 2023. Utilities were responsible for most of the increase, but corporate PPAs increased as well: Microsoft alone announced 1.4 GW of new PPAs, and Meta, Amazon and UnitedHealth Group also reached sizable PPAs.