The New York State Reliability Council’s mathematical model for calculating the state’s installed reserve margin (IRM) every year will need to be updated as more offshore wind and major transmission lines come online, NYISO told stakeholders last week.
“That would be a reasonable expectation as we get further along,” said Dylan Zhang, manager of resource adequacy for NYISO. “We’re seeing the curve dynamics fall apart, so the methodology isn’t maybe as robust.”
During the June 26 meeting of the NYSRC’s Installed Capacity Subcommittee, members discussed the breakdown of the model in possible future scenarios where 9,000 MW of offshore wind, with accompanying transmission, would be available to New York City and Long Island.
The IRM is the minimum amount of capacity beyond the forecasted peak demand that must be procured to satisfy the loss-of-load expectation. For the 2024/25 capability year, which began May 1, the council set the IRM at 22%.
The rather complex method for setting the IRM is known as “Tan45.” Hypothetical IRMs are plotted against possible minimum locational capacity requirements (LCRs) for New York City (zone J) and Long Island (zone K), based on how much generation from upstate zones is “shifted” into them. The low point of the curve (representing the lowest possible IRM and highest possible LCR) for each zone is determined by simply excluding generation from certain upstate zones from the total amount of statewide capacity.
An anchor point of each curve is then selected by applying a tangent of 45 degrees at its sharpest bend, and then another formula using the values where the tangents intersect the curves determine the Tan45 inflection points. The final IRM is calculated by averaging both curves’ Tan45 points and rounding up to meet the LOLE.
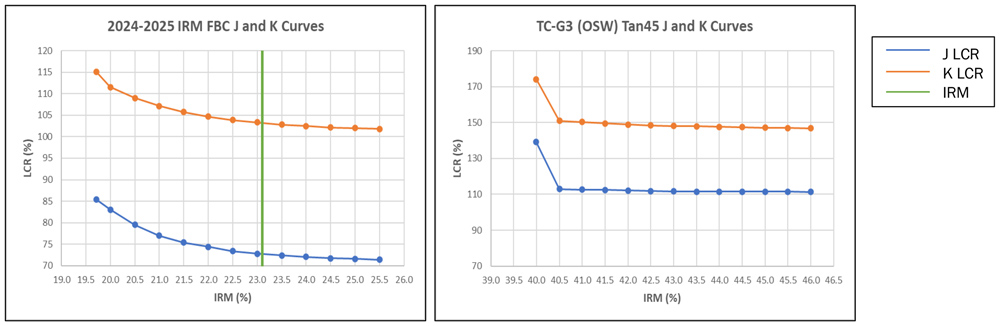
But in future scenarios with the addition of significant amounts of generation flowing into the city, NYISO “observed that the current process to establish the low point no longer appears to operate as intended,” the ISO’s Lucas Carr told the subcommittee.
With less generation needing to be shifted over to zones J and K, the curves flatten. Under one scenario studied, the “low point” of the IRM on the curves reached as high as 39.99%.
“In the older system, when we had more transmission limitations, if you had capacity down in New York City load centers, that provided more reliability than a given megawatt in Buffalo,” said Mark Younger, president of Hudson Energy Economics. “Not surprisingly, it has problems when you start to add a whole bunch of transmission because now the reliability value of an additional megawatt in New York City is not nearly as much as it was before.”
Members of the Installed Capacity Subcommittee said they would need to develop an alternative model before the current methodology breaks down. “Rather than waiting to drive off the edge of the cliff to figure out what to do next, let’s figure it out now,” one member said. “This is trying to do some forward planning. … But we’re good, for now.”
“When the subject was first brought up about [dropping Tan45], that was not well received,” another committee member said. “But it’s not a matter of, ‘Oh we don’t like Tan45.’ It’s a matter of there are issues … coming up.”