
")
The duck curve has landed in New England, not the sunniest of places, but it and California are by no means the only grids that will be greatly affected, says columnist Peter Kelly-Detwiler.

If you follow power markets, then you are familiar with the duck. The solar “duck curve” received its moniker 13 years ago in sun-drenched California, with its emerging multitude of rooftop solar arrays and thousands of megawatts of utility-scale arrays. In that market, the electricity demand net of solar — in other words, the load that must be met with imports and dispatchable resources — frequently drops to zero these days.
Solar also has exerted a significant impact on California’s electricity market, with prices typically falling significantly by mid-day, and then firming up — often tripling — by early evening, before softening again at night and the wee hours of the morning. The fourth quarter of 2024 was a typical example of this dynamic. For the last three months of the year, hourly load-weighted day-ahead prices sat in the high $20/MWh range in the early afternoon, before soaring past $65 around 7 p.m.
A Tale of Two Price Regimes
In California, the duck generally sets the rules, and the other resources — whether imports, batteries or gas generation — respond accordingly. The funny thing about ducks is they have offspring, a fact that is becoming clear in a number of other power markets, with some effects more pronounced than others.
New England, not the sunniest of places, is an instructive example. The first duckling landed there April 21, 2018. On that day, for the first time, net load in the early hours of the morning exceeded mid-day demand. Almost all of the solar creating this change was subsidy-driven rooftop solar. In New England, utility-scale solar typically has lagged behind because there’s simply not a lot of unforested open space to build on.
New England’s duck found suitable rooftop habitat and subsidy-related forage and began to quickly fatten up its belly. By 2022, the region saw 45 “duck days,” with that number vaulting to 73 days the following year and 106 in 2024.
The duck phenomenon is most prevalent in spring, when demand for air conditioning is relatively low, the position of the sun is optimal and there are fewer leaves to block out potential sunlight. Panels also are relatively cool in the spring and operate at higher efficiency.
Though spring is ideal, duck days now occur in every month of the year, and the sag of the duck’s belly grows ever deeper. In fact, Easter 2025 saw ISO-NE record a record all-time low of just 5,250 MW, 1,000 MW below the 2024 record. That dynamic is likely to continue to strengthen. An April 2025 ISO-NE overview forecasts the contribution of solar growing significantly in coming years, from 6,500 MW at the end of 2023 to nearly 13,500 MW by 2033.
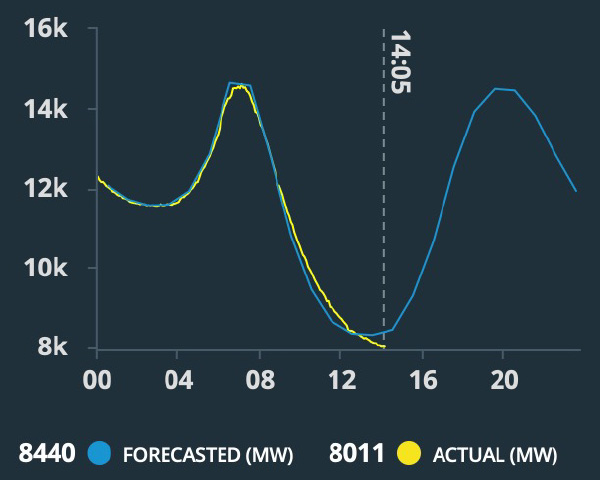
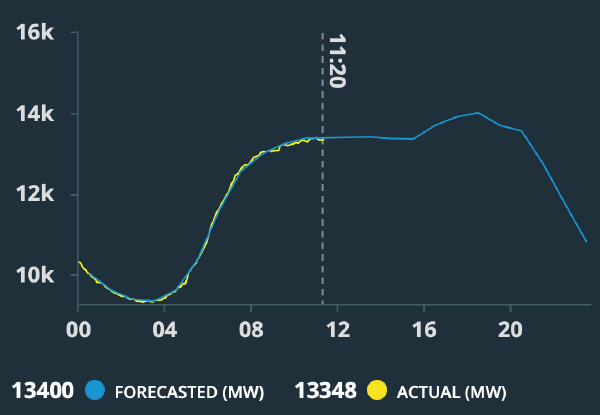
With recent tariff increases affecting the cost of imported solar panels, combined with significant looming cuts to federal tax subsidies, these forecasts now appear less likely. However, additional solar capacity still is likely to be installed for some time, even if added somewhat more slowly. Thus, we will see both frequent and precipitous declines in New England electricity demand daily whenever there’s sun. Prices also will fall increasingly into negative territory at times — that’s already happening. Sunny spring days will look like April 9, shown below, but the roller coaster dips and rises will be much steeper unless we add enormous amounts of storage and distributed resources to the mix.
Sunny days likely will see an increasingly bifurcated world of pricing: one pricing regime on sunny days when the solar resource is active and another when it’s not. Then there will be entire days — like during May’s unusual spring nor’easter — where solar energy barely contributes to the system at all. All of this means that ISO-NE has had to become more sophisticated in its forecasting in this dynamic environment, particularly as it relates to anticipated irradiance, to ensure sufficient resources in the system for those cloudy days.
Where Else the Duck is Nesting
New England certainly has the most pronounced situation in terms of behind-the-meter resources, but it and California are by no means the only grids that are — or will be — greatly affected. A brief look at the interconnection queues (historically, only 19% of what’s in the queue eventually flows power, but it’s still a useful indicator) suggests significant levels of solar energy are on tap for various regions, with some much more affected than others.
Storage also increasingly enters the picture, both in the form of hybrid solar-battery projects and stand-alone ventures. A 2024 review of interconnection queues by region illustrates the sheer magnitude of the solar resource knocking at the door of other grid operators, such as MISO, PJM and ERCOT.
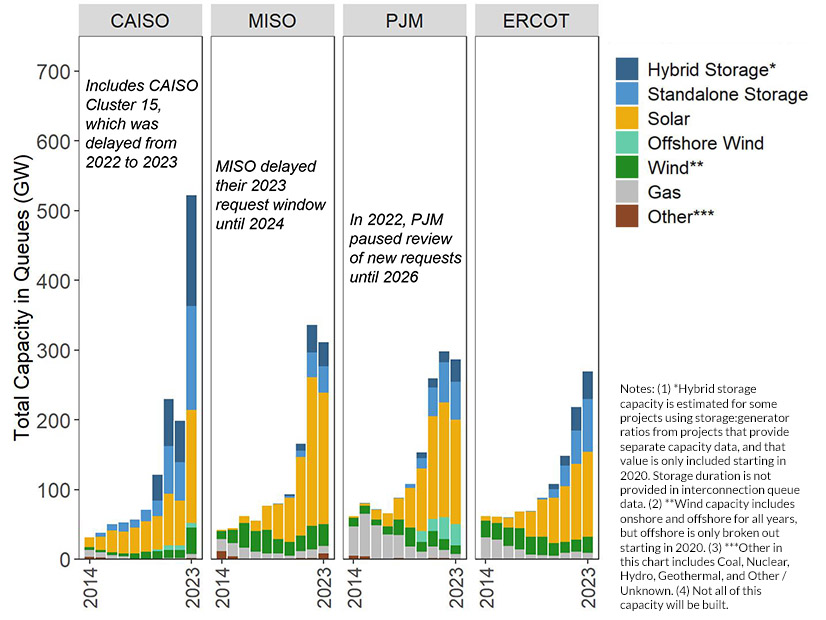
MISO and PJM are only beginning to be affected, as not much solar has been built out yet, but ERCOT already is an entirely different story. In Texas, almost 31,000 MW of solar capacity and nearly 40,000 MW of installed wind generation populate the system, up from 14,000 MW of solar and 36,000 MW of wind just two-and-a-half years ago.
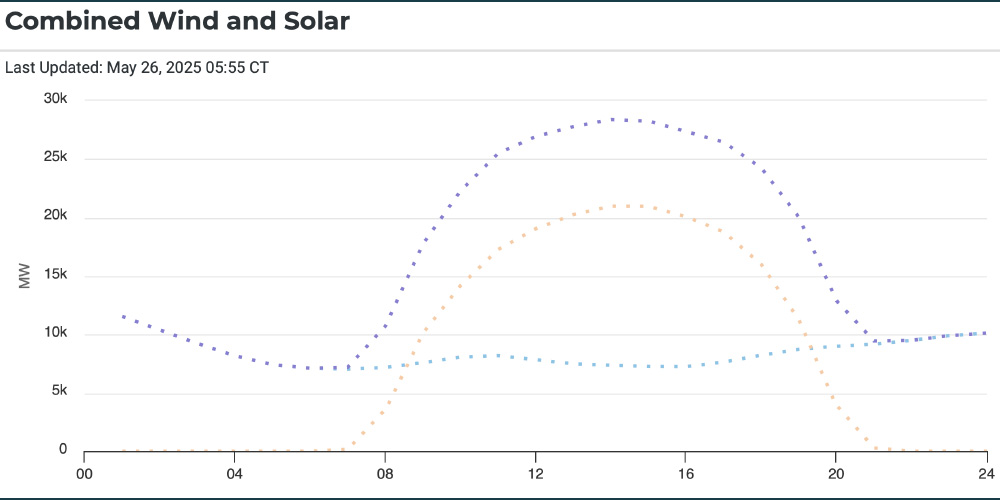
Renewables are so meaningful there that ERCOT daily forecasts the combined output of wind and solar. Some days, the tandem output resembles a cowboy hat, while other days it looks more like a derby.
Here, too, prices tend to soften increasingly by mid-day as Apollo’s chariot ascends higher into the sky. A classic example of that effect would be May 14, when record demand occurred and yet prices did not soar into the stratosphere.
What Subsidies and Policies Give, They Also Can Remove
In recent years, solar energy has benefited from a flood of low-cost panels imported from Asian countries with minimal tariff barriers. This dynamic, combined with fairly generous federal tax policies, was topped off in some areas by generous state policies as well. That landscape has shifted recently. Steep tariff barriers have been erected on imports coming from the four countries from which the U.S. recently imported about 80% of its solar modules, and those tariffs range from 41% to over 350% on some of the larger Chinese-based companies that export most of the panels.
Perhaps even more critically, the U.S. House just narrowly voted to strip the investment tax credits from renewables nearly immediately. That legislation now goes to the Senate, where it is expected to be modified to some degree, though nobody knows quite how this will play out.
Meanwhile, at the state level, California has retreated recently from some of its most generous supports for rooftop solar, significantly reducing economic prospects for investors in on-site solar, with perhaps even more changes to come. Massachusetts — the key supporter of the New England duck — also has rolled back its most generous subsidies in recent years. And Texas just narrowly avoided a major legislative shift that would have dramatically eroded the future potential of solar.
This rapidly evolving political landscape invites the obvious question: “In the absence of significant subsidies, what would a future state look like?” At this point, with so much uncertainty in the air, nobody can say for sure. But the duck certainly is feeling its feathers ruffled.
Around the Corner columnist Peter Kelly-Detwiler of NorthBridge Energy Partners is an industry expert in the complex interaction between power markets and evolving technologies on both sides of the meter.


