By Rob Gramlich
An important fall pastime, along with baseball playoffs, is to look back to see which electric market design model performed best over the summer. For the last several summers, a lot of eyes have been on the ERCOT market, given its relatively low reserve margins and lack of a mandatory forward capacity market. The results are in. There was no firm load shed because of supply shortages, and ERCOT’s 2019 Summer Operational and Market Review stated, “Overall, the market outcomes supported the reliability needs.” My colleagues and I at Grid Strategies ran the revenue adequacy numbers and found that prices did what they should, providing appropriately strong signals to attract new market entry while charging customers only for what they needed.
The key distinction between ERCOT and regions with a capacity market or resource adequacy requirement is that in ERCOT, responsibility for assessing the level of supply and demand need for investment lies with market participants, not the grid operator itself. Other regions are charging customers more than 20% of the total cost of energy, capacity and ancillary services through capacity markets. In contrast, ERCOT focuses on grid operations more like an air traffic controller, saving consumers that money. It uses spot energy and reserves prices to accurately value energy over time and at each location, and lets market participants handle their own price risk management and supply assurance through bilateral contracts. Spot energy values at times of scarcity are allowed to reach $9000/MWh — reflective of true consumer valuation of supply at that time and place — and the value of reserves, which is based on a downward sloping operating reserve demand curve. By keeping dollars in spot markets as opposed to a capacity market, this market design attracts flexibility from demand response, storage, hydro and any other source that delivers when it is needed. There are no drawn out subjective debates with RTO management and stakeholders about what resources should count how much toward the elusive concept of “capacity,” and what public policies should be mitigated, as is the case in the Northeast. (See our paper showing how the minimum offer price rule costs PJM consumers $5.7 billion extra per year.)
One would expect that when the system is low on capacity — as it was this summer with around an 8% reserve margin — prices would occasionally be very high and on average equal or exceed the amount that efficient new units need annually to recover their capital investment cost. In economic theory terms, in an efficient market at equilibrium, over the course of the year there would be enough “rent,” or profit earned from prices that exceed generators’ operating costs, that new generators see enough profit incentive to enter. So the question is, were prices over the last year high enough to attract and retain needed units? Our analysis below indicates the answer is YES.
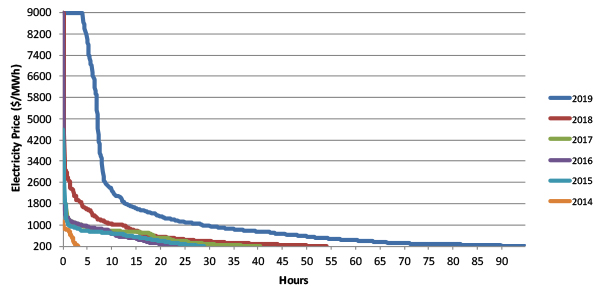
Let’s take a look at the prices in 2019 so far (see our blog for data, assumptions and methodologies). The figure below uses ERCOT historical real-time ORDC data generated during each security-constrained economic dispatch interval to display the number of hours that prices have exceeded generators’ operating cost from January through September.

As shown above, prices have been consistently higher this year than in previous years. So far, prices have already exceeded $200/MWh for 95 hours, with four hours and 10 minutes reaching the systemwide offer cap price. This September alone, with the most record-high temperature days since 2011, was responsible for 10 minutes worth of prices at the offer cap and 20 hours worth of prices above $200/MWh. For reference, 2018 saw 54 hours over $200/MWh and only 10 minutes at the offer cap. Since the creation of the ORDC in June 2014, ERCOT only saw prices hit the offer cap one other time in 2016 for five minutes.
So prices have been higher, but were they high enough to attract entry? To answer that question, we can look at net margin for different units. In Grid Strategies’ analysis of year-to-date data, efficient new peakers earned 35% above what they need to earn in an average year to pay for the capital cost of building the units, and combined cycle units earned 25% above that target. In most prior years when reserve margins were higher, they earned less than this target level.

These high spot prices signal to retail electric providers to go out and sign more contracts with generators so they can shield themselves from high spot market prices in the future. Those long-term power purchase agreements are then used by prospective generators to finance their new plants. An influx of 4,000 MW of solar and 5,000 MW of wind plants expected by next summer will likely take care of much of this need. Market participants also have clear responsibility and incentives to seek sources that shield them from high prices when wind and solar output is low. The Public Utility Commission of Texas reviews those entities’ creditworthiness to make sure they are financially equipped to serve the load they commit to serve — an important and often forgotten regulatory responsibility of state commissions. Few customers actually had to pay the high spot prices, as they were covered by contracts signed well in advance, and the prices withstood the mild political opposition without regulatory intervention.
This year may have been the best test to date of the ERCOT market design. The results so far indicate that despite the hot summer and low reserve margin, no firm load was shed because of supply shortages, while the system did provide sufficient price signals to attract and retain needed resources. High spot prices did not attract political intervention, and consumers only paid for what they needed. ERCOT’s 2019 experience should answer a lot of questions about whether ERCOT’s unique market design works. One thing is for sure though: Our October pastime of reviewing the past summer’s power market results will come again as surely as the sun rises or the baseball playoffs begin.
Rob Gramlich is founder and president of Grid Strategies LLC, a clean energy grid consulting firm.