By Rich Heidorn Jr.
Lower natural gas prices and increased renewable penetration pushed wholesale power prices down sharply in most of the country last year, FERC reported last week.
The commission’s 2019 State of the Markets report noted that prices dropped 20% to 30% in MISO, PJM, NYISO and ISO-NE compared with 2018. Prices in northern CAISO were down 10%, and those in southern CAISO down 20%.
SPP’s prices were the lowest of the organized markets, averaging $30.43/MWh, unchanged from a year before, according to the report by the Office of Energy Policy and Innovation’s Division of Energy Market Assessments (DEMA).
Only ERCOT saw an increase, as record-high demand in summer pushed prices for the year to $49.65/MWh, up 20%.
Natural Gas
Although natural gas demand hit new highs, record-high production and relatively mild weather resulted in price declines of 35% to 41% at hubs in the Mid-Atlantic, New England and New York City. The biggest drops were in the Southwest, where hubs traded at negative prices at times because of pipeline takeaway capacity constraints.
U.S. natural gas production rose to 92.2 billion cubic feet per day (Bcfd) in 2019, up 8.4 Bcfd, the second-largest increase since the advent of shale exploration. Net gas exports averaged 5.1 Bcfd through November 2019, up from 1.9 Bcfd in 2018.

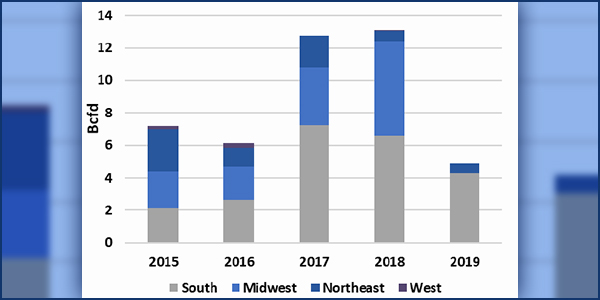
U.S. natural gas pipeline in-service capacity additions by region (Bcfd) | FERC Office of Energy Projects
Natural gas shippers added nearly 5 Bcfd (17 miles) of commission-jurisdictional pipeline capacity in 2019, down from the 13 Bcfd added in 2018.
Overall natural gas demand increased 2.6 Bcfd to 84.9 Bcfd in 2019, a 3% jump. Demand for electric generation averaged 30.9 Bcfd, up 7%, with a 12% increase in the Midwest.
Fuel Mix
Natural gas was responsible for 42% of generation nationwide between January and November 2019, according to the Energy Information Administration (EIA), with 26% from coal, 22% from nuclear, 4% from wind and 1% from solar.
MISO and SPP were most dependent on coal, which accounted for 43% of the regions’ generation. Solar and wind were big contributors in CAISO and SPP, respectively.
As in recent years, most new generation was natural gas or renewables and most retirements were coal plants.

Generation by fuel type | ABB Velocity Suite
The biggest retirements were the 670-MW Pilgrim Nuclear Power plant in ISO-NE (May 2019) and the 980-MW Three Mile Island nuclear power plant in PJM (September 2019).
PJM added 356 MW of natural gas-fired capacity, mostly combined cycle units. MISO saw a net decrease of 852 MW as it lost 2.9 GW of coal-fired capacity and gained 969 MW of natural gas and 997 MW of wind capacity.
SPP added 1.8 GW of wind capacity and had no retirements in 2019.
CAISO’s capacity dropped by 21 MW, losing 600 MW of natural gas capacity and adding 561 MW of solar.
Storage, DERs
Battery storage capacity increased by 174 MW in 2019, down from a 202-MW boost in 2018. But EIA forecasts about 400 MW of new battery storage will be added in 2020 and 1,816 MW in 2021.
“While it is unlikely all planned facilities will be operational by the end of 2021, the large increase represents a sea change in the role that battery storage plays in the bulk power system,” FERC said.

Battery storage capacity additions in recent years | EIA Form 860M
Battery storage additions have been clustered in a few states, led by California with 38% percent of planned capacity through 2023.
Capacity from distributed energy resources using net metering rose 4 GW to a record 23 GW in 2019, most of it in California, New Jersey, Massachusetts, Arizona and New York. The five states represent 70% of the net-metered capacity in the country, including California’s 40% share.
All but 6% of net metered capacity is solar PV. Solar PV’s price dropped 37% between 2013 and 2017, FERC said.
Transmission
Order 1000 transmission planning regions had 309 transmission projects go into service during the year, led by MISO (104) and PJM (101). In 2019, PJM, ISO-NE and NYISO each announced, or awarded to developers, new transmission projects using the competitive bidding processes in Order 1000.

Transmission additions by transmission planning region | C Three Group