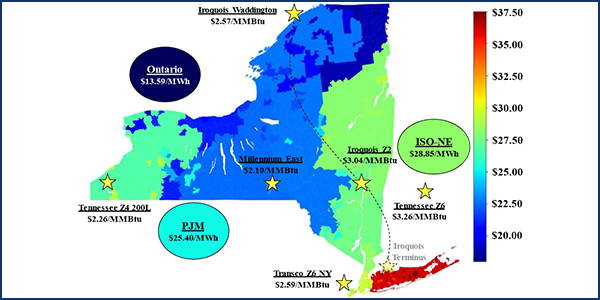
Potomac Economics’ 2019 State of the Market Report for NYISO adds five new recommendations while concluding the ISO’s markets “performed competitively” in 2019.
Potomac’s Pallas LeeVanSchaick told the NYISO Management Committee on Wednesday that 2019 energy prices were the lowest in the past decade, dropping 22 to 34% from 2018. He cited a 22 to 41% drop in natural gas prices from expanded production, and muted demand from a mild winter and summer.
Mild weather, energy efficiency and behind-the-meter solar generation contributed to the lowest average load in more than a decade, the ISO’s Market Monitoring Unit said.
Capacity prices also fell to 8 to 26% of the net cost of new entry (CONE) outside of New York City, thanks to reduced local capacity requirements and new capacity additions. Although New York City prices rose, they still represented only 58% of net CONE. “That’s an indication of significant capacity surpluses,” LeeVanSchaick said.
The five new recommendations are in addition to 17 from prior reports.
Only one of the new recommendations — modifying the “Part A” test to allow public policy resources to obtain exemptions when it would not result in price suppression below competitive levels — was identified as a high priority. The MMU said the change is needed to ensure buyer-side mitigation (BSM) rules are balanced between protecting the market from price suppression and facilitating the state’s desire to control its resource mix.
“The BSM measures were originally designed to prevent entities from suppressing capacity prices below competitive levels by subsidizing uneconomic new entry of a conventional generator,” the Monitor said. “The BSM measures are not intended to deter states from promoting clean energy and other legitimate public policy objectives.”
It said it supports a plan NYISO developed with stakeholders that allows public policy resources to avoid mitigation if enough existing capacity exits the market, or if demand increases enough to boost capacity requirements. The proposal was filed with FERC on April 30 (ER20-1718).
The MMU also recommended that:
- Day-ahead and real-time reserve clearing prices should incorporate reserve constraints for Long Island. Currently reserve providers on Long Island are paid clearing prices for the larger Southeast New York region. Changing the compensation would improve incentives and “provide better signals to new investors in … the long term,” the Monitor said.
- Increase the offer/bid floor from -$1,000/MWh to -$150/MWh. Negative prices are used when ISO operators reduce external interface limits or curtail external transactions to maintain transmission security on an external interface. In this rare situation, external transaction schedulers can buy power at “arbitrarily” low prices, resulting in uplift for NYISO customers. “We recommend raising the bid and offer floor to a level that is closer to the range of potential avoided costs of supply for generation resources,” the Monitor said. “Negative $150/MWh should be more than adequate to provide such flexibility.”
- Translate the annual revenue requirement for the demand curve unit into monthly demand curves reflecting their reliability value. NYISO’s capacity market currently is divided into six-month summer and winter capability periods with a single capacity requirement and demand curve for each, although the reliability value of resources is much greater in high-demand July than the shoulder month of October. The bifurcation “may lead to inefficient incentives for resources that are not consistently available during all 12 months,” the Monitor said. It recommended switching to monthly capacity demand curves with a minimum reference point high enough to ensure resources have incentives to coordinate planned outages with the ISO. The remainder of the demand curve unit’s annual revenue requirement would be allocated in proportion to the marginal reliability value of capacity across the 12 months. “These changes would concentrate the incentives for resources to sell capacity into New York during the peak demand months of the summer (i.e., June to August),” it said.
- Translate the demand curve reference point from installed capacity (ICAP) to unforced capacity (UCAP) terms based on the demand curve unit technology. The capacity demand curves currently are based on net CONE, estimated in ICAP terms and then converted into UCAP based on the regional average derating factor, which reflects the forced outage rates of the existing fleet and UCAP-ICAP ratios of intermittent resources. This technique results in the monthly capacity demand curves being set higher than if the derating factor of the demand curve technology were used. “This inconsistency will become more pronounced as additional intermittent resources are added to the system,” the Monitor said.


