
Good news! California may not know what caused the rolling blackouts last month, but it does know that 25 years from now, a zero-carbon grid would be totally reliable.
That’s the verdict of California Energy Commission Chairman David Hochschild and other commissioners at a joint agency workshop on state law SB 100, which requires a zero-carbon grid by 2045, early this month. (See Study: Calif. Must Build Renewables at Record Rate.)
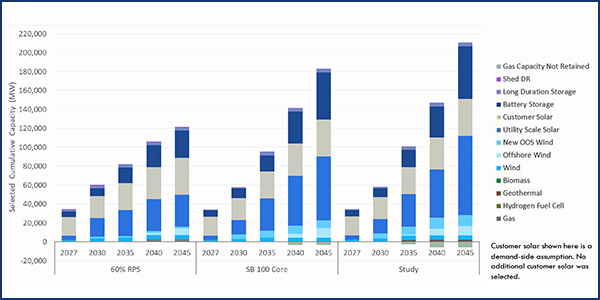
The core scenario presented at the workshop calls for a staggering amount of new solar (109 GW), new wind (30 GW) and new batteries (50 GW). For context, this would be a 528% increase from existing solar, 488% in wind and 5,417% in batteries.[efn_note]Existing solar and wind resource data from the Energy Information Administration’s Electric Power Monthly, Table 6.2.B. Existing battery resource is existing and planned by end of 2020. https://www.utilitydive.com/news/largest-battery-resource-connects-caiso-system/581540/.[/efn_note] All this results in a projected annual resource cost of $66 billion and a generation rate cost component of 16 cents/kWh — about double the current one.
We’ll get into the weeds below, but there were some red flags right at the outset. First is that the study’s modeling was adapted from the California Public Utilities Commission’s 2019 integrated resource planning model, which is the same model that said the chance of rolling blackouts last month was 1 in 500.
Second, CEC staff said that the study was “not explicitly testing the reliability of the portfolios.”
Third, this gathering of multiple agencies unintentionally confirmed the elephant in the room: no unity of command for planning and reliability. As long as that continues, so will the blackouts and the finger pointing.
With those warm fuzzies out of the way, let’s roll into the weeds.
Peak Day Resource Adequacy
With general load growth and high electrification (electric vehicles, building electrification, etc.), the study projects peak-day demand in 2045 of 87 GW and adds a planning reserve margin of 15% for a resource adequacy requirement of 100 GW (slide 11).[efn_note]The workshop slides are here, https://efiling.energy.ca.gov/getdocument.aspx?tn=234549.[/efn_note]
How is that covered? Slide 17 from the workshop shows how. Please focus on the middle column showing “SB 100 Core,” which is the principal scenario, supposed to reflect compliance with SB 100.
Starting from the top of the stack, first is “Variable Renewable ELCC,” which looks to be about 20 GW. But existing and new solar of 130 GW at an effective load-carrying capability (ELCC) of 2%, as shown on the slide, would be about 3 GW, and existing and new wind of 36 GW at an ELCC of 19% would be about 7 GW, for a total solar and wind ELCC of 10 GW. Not 20 GW. Problem.[efn_note]It is possible that the reported ELCCs on slide 17 are marginal values rather than cumulative, in which case this concern may be misplaced.[/efn_note]
Next in the stack is “Long Duration Storage”[efn_note]”Long duration storage” is a bit of a misnomer as it appears to refer to hydro pumped storage of 12 hours duration.[/efn_note] of roughly 7 GW, and then four-hour batteries of about 30 GW. Batteries are problematic for reasons I’ve discussed before.[efn_note]It is possible that the reported ELCCs on slide 17 are marginal values rather than cumulative, in which case this concern may be misplaced.[/efn_note] If you don’t believe me, check out the concerns of CAISO here. (By the way, this CAISO document from last year foretold last month’s crisis pretty well.)[efn_note]http://www.caiso.com/Documents/Jul22-2019-Comments-PotentialReliabilityIssues-R16-02-007.pdf (pages 12-14).[/efn_note]
Next is “Zero Carbon Firm” of roughly 12 GW. This is a catch-all for a variety of possible resources, most of which were excluded from the study as impractical and/or uneconomic and don’t show up in any material way in the chart of capacity additions (slide 15). It seems to be basically green hydrogen fuel cells.

Those won’t come cheap. This unproven technology involves additional “off-grid” solar and wind generation converted to hydrogen by electrolyzer,[efn_note]The Inputs & Assumptions document refers to “assuming off-grid California wind or solar to power the electrolyzer…” https://efiling.energy.ca.gov/getdocument.aspx?tn=234532 (page 41, fn. 20).[/efn_note] compression and storage of the hydrogen, transportation of the hydrogen and conversion of the hydrogen back to electricity via fuel cells. The study presents a projected hydrogen fuel cost of $37.68/MMBtu, 825% more than natural gas, which also doesn’t appear to include the cost of the fuel cell itself and perhaps not fuel cell efficiency loss.[efn_note]Inputs & Assumptions document (pages 84 and 43).[/efn_note] By the way, the soup-to-nuts efficiency is 30%, which makes green hydrogen fuel cells a good way to turn a lot of renewable generation into not so much usable a resource.[efn_note]https://www.greentechmedia.com/amp/article/the-reality-behind-green-hydrogens-soaring-hype. By the way, a good critique of the hype around dirt-cheap future hydrogen is here, https://theicct.org/sites/default/files/publications/final_icct2020_assessment_of%20_hydrogen_production_costs%20v2.pdf.[/efn_note]
Next is about 5 GW of “Import Capacity.” We know how that goes when the West is hot. California has only 2,230 GW of dedicated import resources (Palo Verde and Hoover).[efn_note]Inputs & Assumptions document (page 91).[/efn_note]
Finally, the stack shows about 28 GW of “Fossil Firm,” which was explained at the workshop to essentially be the existing gas fleet. It also was stated at the workshop that carbon sequestration was excluded from the study.[efn_note]”Candidate Resources … • Removed Natural Gas w/ CCS due to insufficient cost data” (slide 7).[/efn_note] So this gas can’t be a zero-carbon resource.
Here’s how I add it up from what’s tangible. Solar and wind ELCC capacity value of 10 GW, long-duration storage of 7 GW, dedicated import resources of 2 GW and if you optimistically add batteries of 30 GW, you get to a zero-carbon resource adequacy value of 49 GW. And then there is the non-zero-carbon gas of 28 GW, which isn’t supposed to be there.
Good luck on that peak day when you need 100 GW.
The workshop did present a true zero-carbon scenario in which more green hydrogen fuel cells essentially replace the gas fleet (slide 33, comparing year 2045 columns). Assuming that, by my math, California would need about 50 GW total of this very expensive, unproven resource.
Piece of cake.
Multiday/Monthly/Seasonal Resource Adequacy
The study does not consider multiday, monthly or seasonal resource adequacy. But such consideration is critical in a system that relies on limited-duration storage resources like batteries.
Why? Because batteries depend on the availability of excess generation over consumption on a given day to recharge batteries depleted the day before. Fossil fuels, in contrast, are effectively 24/7 energy storage, and not dependent upon other resources to recharge. Big difference.
The problem can manifest over varying time periods: whenever there isn’t enough excess generation to recharge batteries before they’re needed again. That could be because of cloud cover for a week that greatly reduces solar generation that would otherwise recharge the batteries, or fires producing smoke and ash that reduce radiance and cover solar panels. Maybe an extended lull in winds greatly reduces wind generation for a week or two.
Beyond this sort of day/week volatility, there is predictable monthly and seasonal variation. This chart from EIA data shows monthly solar generation in California in 2019.[efn_note]At EIA’s Electricity Data Browser here, https://www.eia.gov/electricity/data/browser/, choose the “Net generation” data set, then filter for California and all solar generation, and select the time period and monthly output on a time series basis.[/efn_note] You can see that the high months are more than twice the low months.

In contrast, this chart shows that California’s monthly electric consumption (unlike some other regions with, for example, heavy summer air conditioning load) is fairly steady throughout the year.[efn_note]At the Electricity Data Browser, choose the “Retail sales of electricity” data set, then filter for California and all sectors, and select a time period and monthly output on a time series basis.[/efn_note]

So the problem is with a month like December, with relatively low solar generation and yet average consumption. I crunched study inputs and EIA data to find that California consumption in December would be about 46,250 GWh.[efn_note]The study projects California annual generation in 2045 of 500,000 GWh (slide 16), which I grossed up for transmission and distribution losses of 7.24% (Inputs & Assumptions, page 7) to get annual consumption of 539,000 GWh. Then, to get December’s share of that, I divided December 2019 consumption by total 2019 consumption from EIA’s Electric Power Monthly for December 2019, Tables 5.4.A and 5.4.B. Applying the share percentage of 8.58% to annual gives December 2045 consumption of 46,250 GWh.[/efn_note] When I add up California’s existing renewable generation that month (including imported hydro and Palo Verde nuclear), I get 8,760 GWh.[efn_note]Existing California renewable generation for December 2019 comes from Electric Power Monthly for December 2019, Tables 1.10.A, 1.14.A, 1.15.A, 11.16.A and 1.17.A. Imported hydro and nuclear estimated from the Inputs & Assumptions document, pages 22 and 29.[/efn_note] Then I apply December capacity factors for wind and solar to the new wind and solar resources and get 18,000 GWh.[efn_note]California renewable capacity factors for December 2019 calculated from Electric Power Monthly for December 2019, Tables 1.14.A, 1.17.A and 6.2.B. I used the study’s capacity factor for offshore wind of 52%. The capacity factors are applied to the new renewable resources listed at the beginning of the column.[/efn_note] So, total existing and new renewable generation is 26,760 GWh.[efn_note]Please note that batteries and other storage such as 12-hour pumped storage can’t help a monthly deficiency. They can’t recharge without depleting the supply needed for load.[/efn_note] There is a 19,490-GWh deficiency, i.e., blackouts.
Now, we could assume that the existing gas fleet is still around, despite being a non-zero-carbon resource. I reckon 28 GW of gas running at a 94% capacity factor could cover the deficiency — if levels of consumption and other generation cooperated perfectly. But that doesn’t do much for a zero-carbon future.
As with the peak-day analysis, to achieve true zero carbon, the study presents a scenario that assumes green hydrogen fuel cells replace gas generation. The study projects a green hydrogen fuel cell cost of $126/MWh in 2045 (slide 28), making the cost of covering the December deficiency around $2.5 billion.
And that’s just one month, on top of the massive costs of new solar, wind and battery resources.
What’s the Takeaway?
A zero-carbon, reliable, affordable future remains an enormous challenge. We should be realistic and not sugarcoat this.
Nor should we throw staggering amounts of solar, wind, batteries and fuel cells at the problem and hope for the best. We need to think about all the options, especially on the consumption side of the equation. Efficiency (e.g., LED lighting, which has reduced carbon emissions twice as much as rooftop solar[efn_note]http://www.energy-counsel.com/docs/LED-Kills-the-Edison-Star-2017-01-24%20RTO-Insider-Individual-Column.pdf.[/efn_note]), demand response, load shifting (hot water heating) and time-of-use rates are a few examples.
And on the resource side, let’s not make big mistakes, such as subsidizing rooftop solar that costs four times as much as grid-scale solar.[efn_note]Grid-scale solar is about $40/MWh levelized cost of energy while rooftop solar is about $155/MWh. https://www.lazard.com/media/451086/lazards-levelized-cost-of-energy-version-130-vf.pdf (page 2, using the midpoint for grid solar and averaging the midpoints for both rooftop solar types). California could more than cover the (staggering) costs of 70 GW of new grid solar simply by not subsidizing rooftop solar.[/efn_note] And is it too late to save Diablo Canyon like I urged four years ago?[efn_note]http://www.energy-counsel.com/docs/Helter-Skelter-September-Fortnightly.pdf.[/efn_note] Remember when those insisting on closure said an estimated cost of $69 to $72/MWh made it too expensive to keep?[efn_note]https://www.nrdc.org/experts/peter-miller/diablo-canyon-legislation-signed-law-governor-brown.[/efn_note]
Now even that inflated cost looks like a bargain compared to $126/MWh for green hydrogen fuel cells.