
NYISO energy markets performed competitively in the third quarter of 2020, but the use of out-of-market actions to meet local and statewide reliability needs was a significant concern, the Market Monitoring Unit said Monday.
“One of the big themes in this quarter, partly because of relatively low load levels and low natural gas prices, was the frequent use of out-of-market [OOM] actions to maintain reliability and transmission security,” Pallas LeeVanSchaick of Potomac Economics said in presenting the Market Monitoring Unit’s State of the Market report for the third quarter to the Installed Capacity/Market Issues Working Group. “To the extent that you’re meeting reliability needs through out-of-market actions, you’re not providing efficient market signals for investment to meet those needs.”

For the second consecutive quarter, capacity costs constituted the majority of New York City’s all-in prices (62%), because of an increased locational minimum installed capacity requirement (LCR) and very low energy prices, he said. (See “Pandemic Reduced NYC Load by 11%,” NYISO Q2 Energy Prices, Load at 10-Year+ Lows.)
All-in prices ranged from $22/MWh in the North (Zone D) to $69/MWh in the city (Zone J). Prices were up in Zones A-F (1 to 11%) and in the city (21%), but down 18% in the Hudson Valley (Zone G) and 6% in Long Island (Zone K).
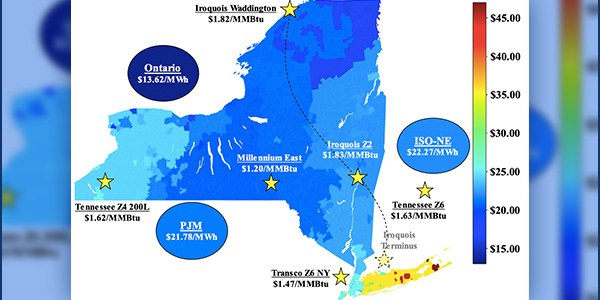
Average natural gas prices fell 15 to 24% from a year ago, resulting in the lowest quarterly average price for a third quarter since at least 2009.

Average load fell slightly, but peak load also rose slightly. The COVID-19 pandemic may have reduced average load by about 3% for the quarter, the MMU said. Load reductions were largest in the city (6%), while many other regions saw increased load for the quarter, such as 2% in Long Island.
Nonetheless, load levels were comparable to levels in the same period a year ago as warmer summer weather largely offset the effects of the pandemic, the MMU said.
OOM a High Priority
“In New York City we saw out-of-market commitments daily to maintain adequate reserves to satisfy N-1-1-0 criteria for some of the 138-kV load pockets as well as for the 345-kV system,” LeeVanSchaick said. “Again, that’s important because those are some of the same areas where reliability needs are being identified by [NYISO], as well as where you have byway deliverability bottlenecks that could make it harder for generation to interconnect in certain areas.”
NYISO has greatly reduced the use of OOM actions to manage congestion in upstate New York over the last two years by modeling most 115-kV transmission constraints in the day-ahead and real-time market models, he said.

In New York City, some local reliability needs are met by Consolidated Edison making manual commitments. In other cases there are constraints in NYISO software that cause a resource to be committed OOM but do not result in prices reflecting local grid needs. So, “it’s not that the NYISO doesn’t see the constraint; it’s that there is no local reserve requirement that sets a clearing price that can be paid to all resources for providing local reserves, so you have to commit something out of market,” LeeVanSchaick said.
Bid production cost guarantee (BPCG), or uplift, payments totaled $20.6 million, up 16%; 26% of BPCG payments were to New York City units, and 63% were to Long Island units, for local reliability needs, the MMU said.
The report lists modeling reserves dynamically and having local reserve requirements to reflect N-1-1-0 criteria as high-priority recommendations.
“Without meeting these requirements through the market, as opposed to out-of-market actions, it’s going to be really difficult to get people to invest in resources that have flexible characteristics and are located in the right areas where they’re needed most,” LeeVanSchaick said.
Mapping Congestion
Day-ahead congestion revenues totaled $84 million, down 34% from a year ago, primarily because of lower gas prices, the report said. Congestion fell by nearly 42% in New York City from the prior year.
But Long Island accounted for the largest share of congestion (33%) this quarter, up 69% in the day-ahead market ($11.4 million) and 11% in real-time ($2.2 million) from a year ago. Load increased on Long Island, with higher residential cooling needs from the pandemic and the hotter-than-normal summer weather.

“The system congestion map indicates that eastern Long Island has a lot of areas that don’t have natural gas service,” LeeVanSchaick said. “The generation in the eastern half of Long Island is in large part higher-cost than in other areas.”
Looking ahead is challenging, he said, because lower NOx limits will take out some generators in the Astoria and LaGuardia areas of Queens, which support areas to the east where there aren’t many generators. That will lead to some reliability needs starting in 2023 that could be met through some other generation or transmission. A similar situation in the Greenwood Heights area in Brooklyn will lead to reliability issues beginning in 2025, he said.


