

Nobody outside our industry understands our industry. And we see ourselves through a glass, darkly.
So with the tragedy in Texas (more specifically ERCOT, which is 90% of Texas’ load), there are plenty of politicians and talking heads spinning what happened and who or what is to blame. They’re mostly wrong.
There are two things not to blame. And two things to blame. Please let me explain.
Thing No. 1 not to Blame: Wind Generation
Yes, there is a lot of wind in ERCOT: around 30,000 MW. And yes, wind is intermittent.
That’s why ERCOT assumes that only a small fraction of maximum wind generation will be available when needed. The amount of available wind that ERCOT assumed this winter is 7,070 MW.[1] And ERCOT ran a sensitivity for low-wind output that assumed 5,279 of that 7,070 MW would not be available, leaving 1,791 MW available.
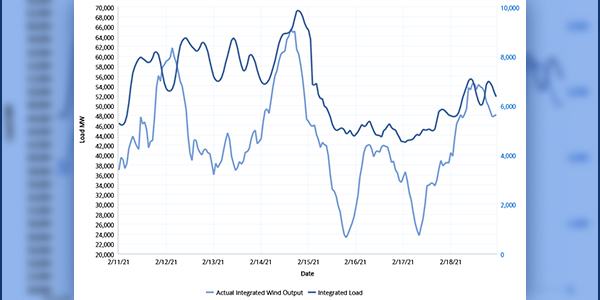
Now let’s look at what actually happened. This chart, “ERCOT Load vs. Actual Wind Output,”[2] shows that actual wind generation (the right vertical axis, in megawatts) during the Feb. 11-18 period had only two brief dips below the low-wind sensitivity of 1,791 MW.

So wind generation is a bit player in this tragedy.
Thing No. 2 not to Blame: Load Forecast
In the fall ERCOT forecasted an extreme weather winter peak load of 67,208 MW.[3] Now let’s look at the same chart showing ERCOT load during Feb. 11-18 (this time the left axis). The peak load was 69,222 MW, at 8 p.m. on Feb. 14.[4] This is only 2,000 MW more than the forecasted extreme weather peak load, and this forecasted peak was exceeded for only five hours.
Now to complete the picture, we need to recognize that early in the morning of the next day, Feb. 15, ERCOT began shedding load. So we would need to add back load shed in order to simulate unrestricted load. The load shed began at 10,500 MW at 1:25 a.m., and grew to 16,500 MW later that day.[5] If you look at the chart and envision the addition of the load shed, you’ll see that the unrestricted load does not exceed the peak at 8 p.m. on Feb. 14 of 69,222 MW.[6]
So the load forecast is also a bit player in this tragedy.
Thing No. 1 to Blame: Thermal Generation Maintenance Outages
Now we’ll discuss the real culprits: thermal generation (gas, coal and nuclear) or, more accurately, the lack thereof.
Two things went wrong with thermal generation: maintenance (planned) outages and forced (unplanned) outages.

To understand what happened with the first thing, please look at the chart “Seasonal Risk Scenario,”[7] which was prepared by the NERC in November 2020 from data provided by ERCOT. This is a “waterfall” chart starting with gross winter resources on the left side, and then making adjustments to arrive at expected net resources relative to extreme winter peak demand on the right side. As you can see, ERCOT forecasted an expected operating reserve of 2.3 GW under extreme conditions.[8]
If you look at the second bar from the left, ERCOT forecasted 4.1 GW of “typical maintenance outages.” Here’s the problem: ERCOT approved 14 GW of maintenance outages for this period,[9] about 10 GW more than it had forecasted.
This appears to be grid operator error.
Thing No. 2 to Blame: Thermal Generation Forced Outages
Now to thermal generation forced outages. Please look at the same chart, this time the third and fourth bars from the left. The third bar shows “typical forced outages” for thermal generation of 4.5 GW, and the fourth bar shows “derates” (outages) for “extreme conditions” for thermal generation of another 4.5 GW. The total is 9 GW, which is the forced outages for thermal generation under extreme conditions.[10]
Actual thermal generation forced outages: about 18 GW.[11] So actual forced outages were 9 GW more than ERCOT’s extreme conditions scenario.
To recap, there were 10 GW of excess maintenance outages and 9 GW of excess forced outages, for a total of 19 GW in unanticipated thermal outages, in line with the necessary load shed of 16.5 GW.
The Why
As I said earlier, the excess maintenance outages appear to be grid operator error.
But what about the excess forced outages? Extreme winter conditions regularly occur around the U.S. and the world without catastrophic loss of electric generation.
ERCOT has a market design that assumes that as long as wholesale prices are unlimited, supply and demand will always “clear” — basically equalize. New resources will be built and upgraded in anticipation of occasionally getting very high prices. And existing resources would incur new capital costs in order to receive those very high prices occasionally.
The problem has always been that the needed high prices occur rarely — like every 10 years — when they max out at $9,000/MWh, 360 times a typical wholesale price of $25/MWh. Who would finance and build needed resources and their winterization on such a GameStop bet? And when such prices do occur, the political, regulatory and market fallout can be staggering.[12]
Because of these real-world limitations, grid operators like PJM have adopted a hybrid market structure: a capacity market to assure that adequate resources will be available when needed, and an energy market that matches supply and demand on a least-cost basis every hour.
A capacity market spreads the needed compensation to maintain, build and secure adequate supply resources over every day, month and year instead of requiring speculation over a burst of revenue that happens maybe once every 10 years. And it penalizes any resource that does not perform when needed. The cost to customers is spread over time instead of unpredictable price surges maybe every 10 years.
It’s a form of insurance: You don’t need it until you need it.
As The Economist observed:[13]
“Perhaps most important, the state [Texas] does not have a ‘capacity market’ to ensure that there was extra power available for surging demand. Such systems elsewhere act as a sort of insurance policy so the lights will not go out, but it also means customers pay higher bills.”
Let me close by wishing the best to the good people of Texas, and the hope that we all learn the right lessons from this tragedy.
[2] http://mis.ercot.com/misdownload/servlets/mirDownload?mimic_duns=000000000&doclookupId=759433704, page 4.
[3] Same as footnote 1.
[5] ERCOT news releases, http://www.ercot.com/news/releases.
[6] A Rice University atmospheric scientist estimated the unrestricted load at about 70,000 MW. https://www.popsci.com/story/environment/texas-power-outages/. The consultancy Enverus forecasted peak load on Feb. 15-16 of 66,000 to 69,000 MW in a Feb. 12 webinar. https://www.enverus.com/blog/trading-and-risk/volatility-ahead-freezing-cold-sends-u-s-power-prices-higher/, at 6:20. The U.S. Energy Information Administration reports that ERCOT forecasted some hours above 70,000 MW. https://www.eia.gov/todayinenergy/detail.php?id=46836
[8] Wood Mackenzie points out that ERCOT does not combine extreme conditions of high thermal outages and low wind when comparing to extreme winter peak load.
[9] https://www.woodmac.com/news/editorial/Breaking-down-the-texas-winter-blackouts/full-report/. Wood Mackenzie also reports that in the week before the storm hit, ERCOT tried to recall some of this generation but was not successful in doing so. Although Wood Mackenzie described all 14 GW as “offline for maintenance,” it is possible that some of that were forced outages, in which case that portion should be added to excess forced outages discussed in the next section. ERCOT apparently does not have the literal power to reject planned outage requests submitted more than 45 days in advance, but it is difficult to believe that a generator would insist on its timing if ERCOT advised that system reliability would be denigrated.
[10] Wood Mackenzie points out that ERCOT does not combine extreme thermal outages and the low-wind sensitivity when comparing to extreme winter peak load and that, if ERCOT had done so, it would have shown a negative operating reserve of 4 GW.
[11] Wood Mackenzie reports that total thermal outages the morning of Feb. 15 went from the 14 GW of maintenance outages to 32 GW, the difference being 18 GW of forced outages. A chart stacking forced outages on top of maintenance outages is in an article by Enverus here, https://www.enverus.com/blog/trading-and-risk/ercot-power-grid-outage-what-went-wrong/.


