By Rory D. Sweeney
When stakeholders begin considering potential changes to PJM’s demand curve next month, one of the main debates will likely center on whether combustion turbines (CTs) should remain the reference technology for estimating the cost of new entry (CONE) or be replaced by combined-cycle gas turbines (CCGTs).
PJM will take up the issue of revising its variable resource requirement (VRR) curve at its Market Implementation Committee meeting on May 2.
The review, which occurs every four years, must be completed by Aug. 31 to be filed for FERC approval by Oct. 1 and put in place for use in the 2019 Base Residual Auction (BRA). PJM has until May 15 to recommend proposed Tariff revisions, which are based on an analysis by the Brattle Group, who provided recommendations of its own, some of which differ from PJM’s.
Brattle’s Analysis
PJM hired the Brattle Group to analyze the shape of the VRR curve, the CONE for areas used in the VRR Curve and the methodology for determining the net energy and ancillary services (E&AS) revenue offset for the region PJM serves and for each zone. Brattle representatives presented their findings to stakeholders on Wednesday.
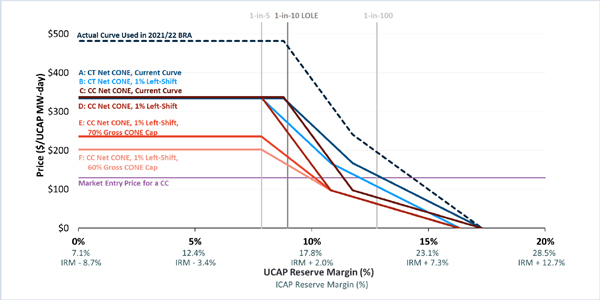
Brattle’s analysis found the Capacity Performance (CP) rules PJM implemented in 2016 would not significantly impact the curve it recommended in its 2014 report, but the net CONE has decreased “substantially” compared with the parameters that will be used this May in the 2021/22 BRA. CP flattens lower-priced offers in the supply curve but doesn’t affect the higher-priced side of the curve.

Capacity Performance rules have flattened out the lower-priced portion of the supply curve but left the higher-priced portion largely untouched. | the Brattle Group
“This reduces instances of very low prices and volatility but does not change results under high-priced, low-reserve-margin conditions that drive reliability performance,” the report said.
However, reducing net CONE would shift the VRR curve substantially down, such that the cost to procure PJM’s installed reserve margin (IRM) would be potentially cheaper by hundreds of dollars per MW-day.
Removing CT Base
Brattle recommended using the net CONE for CCGTs as the reference technology in conjunction with localized adjustments. PJM currently uses the net CONE for CTs, but Brattle’s analysis showed the construction cost for a CCGT has dropped as much as 40% so that it is just slightly higher than that of a CT. Net CONE for CTs also dropped in the updated calculations but not as much as net CONE for CCGTs, which Brattle estimates is between 44% and 76% lower than PJM’s 2021/22 parameters and between 25% and 63% lower than its updated CT Net CONE estimates, depending on location.

Brattle’s analysis shows that its updated calculations for cost of new entry (CONE) has shifted the curve substantially down. Using Brattle’s recommendation to use a combined cycle as the reference technology would also move the curve to the left. | the Brattle Group
“CCs are more economic because their much higher net E&AS revenues more than offset slightly higher plant costs on a per-kW basis,” the report found.
“In reality, net CONE has declined substantially, especially for CCs, and this has major implications for the VRR curve,” Brattle continued. “… If in spite of that reality, PJM maintained a CT as the reference technology for anchoring the VRR curve, [but] continued low-priced entry of CCs would maintain average reserve margins substantially above target.”
Brattle estimated that using a CC as the reference technology, along with adjustments to compensate for triggering an alternative price cap provision, would achieve average reserve margins 1.4% above the IRM target and decrease annual average procurement costs by $212 million compared with the current CT-based curve and $138 million compared with adjusting the current curve 1% to the left to account for the expected over-procurement.
Brattle also determined that if its analysis underestimated the CONE by 20%, the average loss of load expectation (LOLE) would rise to 1.6 events every 10 years rather than its target of 1 event every 10 years.
That said, Brattle didn’t reject using the CT basis.
“We also see an argument for a CT-based curve if PJM and stakeholders are highly risk-averse about ever procuring less than the target reserve margin, since the incremental cost is modest in context,” the report said. “Even a $140-million difference in cost is less than 0.5% of PJM’s total annual wholesale costs.”
Additional Recommendations
Brattle also recommended changes to PJM’s methodology for calculating net E&AS revenues:
- Update gas-pricing points for six locational deliverability areas (LDAs).
- Update unit operating characteristics, such as heat rates.
- Include net CP payments.
- Move maintenance costs from variable operations and maintenance (O&M) costs into the fixed O&M cost component of CONE in the current cost development guidelines.
- Implement forward-looking estimates of E&AS revenues rather than the current three-year historical calculations.
- Calculate E&AS margins for RTO and other multi-zone LDAs based on median across zones.
PJM’s Recommendations
In a letter to stakeholders, PJM recommended updating the CT used as the reference technology to a GE Frame Model 7HA, which Brattle used in its analysis based on project development trends, improved efficiency and lower costs. Stu Bresler, PJM’s senior vice president of operations and markets, noted in the letter that NYISO, ISO-NE and the Alberta Electric System Operator all use CTs as their reference technology.
“The combustion turbine continues to provide the lowest CONE, shortest time to market, and derives the most significant portion of its revenue from the capacity market as compared to other resources. The fact that the CT receives the smallest amount of its revenue from the energy market means that its Net CONE value is the least likely to be significantly perturbed by potential changes in energy market prices,” Bresler wrote. “PJM’s certainty is provided through the use of a peaking unit as a reference resource because it minimizes the exposure to short-term energy revenue offset volatility.”
Maintaining the CT-based VRR curve with updated values for net CONE “will continue to provide long-term reliability at reasonable cost,” Bresler argued.
PJM agreed with Brattle’s CT estimates for all CONE areas except for the “rest of RTO,” which it felt was too low. PJM recommended $282/MW-day in that that zone, Cone Area 3, rather than Brattle’s recommendation of $269/MW-day.
PJM also agreed with several of Brattle’s recommendations on E&AS, including the update to unit operating characteristics and gas pricing hubs and using the median to determine net E&AS offset. It also recommended a 10% adder “to account [for] potential uncertainties in measurement” and to maintain dispatch flexibility.
But it differed on the methodology for calculating generator revenues, recommending use of the sum of the median monthly revenues from the last three calendar years rather than annual revenue averages.
“This approach provides a less volatile year-over-year determination of an annual net E&AS value than that provided by a three-year average by dampening distortion caused by a single anomalous month of unusual weather or fuel market conditions,” Bresler wrote.
PJM has scheduled additional meetings on the VRR curve updates, starting with an afternoon session on May 25. Subsequent meetings are planned for June 22, July 6 and July 27.