By Michael Kuser
RENSSELAER, N.Y. — NYISO energy prices fell sharply in the second quarter, but congestion costs surged during the period despite lower gas price spreads and load levels, according to the Market Monitoring Unit.
Energy prices fell by 9 to 36% in the second quarter compared to the same period last year, while average load dipped to the lowest second-quarter level since 2008, Pallas LeeVanSchaick, of MMU Potomac Economics, told the ISO’s Installed Capacity/Market Issues Working Group on Thursday in presenting its quarterly report on the markets.
Falling locational-based marginal prices and lower capacity costs in most areas accounted for the overall price decline. Average all-in prices fell in all areas and ranged from $20/MWh in the North Zone to $55/MWh in New York City.
While capacity prices were up 4% in the city, they fell by 14 to 56% in other areas of the state because of lower peak load forecasts, uprates and new generation coming online. The report also showed that energy costs fell by 11 to 34% in most regions because of lower natural gas prices, which dropped 17 to 29% from the previous year in Eastern New York.
The Monitor’s 2018 State of the Market Report, presented by LeeVanSchaick in May, showed that rising natural gas costs and increased load levels drove up NYISO electricity prices by 23 to 36% last year, with peak load up 7% — “quite a large increase,” he said. (See “State of the Market: Peak Load Up 7%,” NYISO Business Issues Committee Briefs: May 13, 2019.)

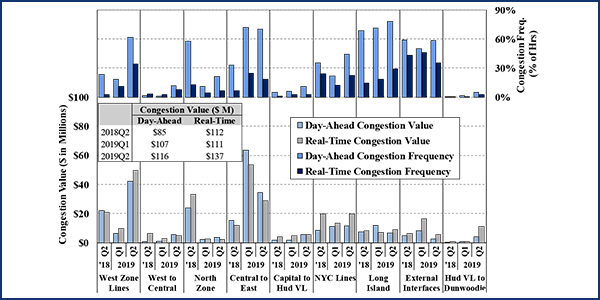
DA Congestion Revenues Rise 37%
Day-ahead congestion revenues rose 37% from the second quarter of 2018, the Monitor reported.
The West Zone marked the largest increase in congestion costs because of the combined effects of modeling 115-kV constraints in the market software; more costly transmission outages; the return to operation of the South Ripley-Dunkirk 230-kV line on the PJM-NYISO seam, which has increased the impact of loop flows; and an increase in imports stemming from low Ontario spot prices.
“West Zone constraints were hard to manage despite recent modeling enhancements,” LeeVanSchaick said. “The most significant factor leading to BMS [Business Management System] limit reductions was the cap on clockwise changes.”
The BMS and Energy Management System (EMS) encompass the critical core reliability functions on the grid. When physical (EMS) flows exceed flows considered by the scheduling models (BMS flows) by a significant margin, the ISO reduces scheduling limits to ensure flows remain at acceptable levels.
The cap on clockwise changes in circulation was previously set at 75 MW per real-time dispatch (RTD) interval, which prevented dispatch from reducing flows sufficiently after sudden changes in loop flow. NYISO increased the cap to 125 MW in June and 200 MW in July.

NYISO increased the constraint reliability margin (CRM) on the Niagara-Packard 230-kV lines and the Niagara-Robinson Road 230-kV line from 20 MW to 40 MW in June and to 60 MW in late July to assist in managing the constraints.
Noting the change to the Niagara-Packard and Niagara-Robinson Road CRMs and cap on loop flow changes, Chris Wentlent, representing the Municipal Electric Utilities Association of New York State, asked, “Are those going to remain in place going forward?”
“They’re not temporary, but the CRMs and the cap on circulation changes can always be modified,” LeeVanSchaick said. “The increased cap on circulation changes recognizes that the dispatch model needs to redispatch generation when circulation changes by a large amount.”
Moving East and South
“NYISO is looking whether to relocate the proxy bus for Ontario to reflect that those imports tend to increase unscheduled power flows in the clockwise direction around Lake Erie,” LeeVanSchaick said.
Another issue has to do with the Saint Lawrence phase angle regulator (PAR), which can be used to reduce congestion in the West Zone by diverting a portion of Ontario imports to northern New York, but the PAR is generally less flexible than assumed by RTD.
In August, the ISO reduced the optimization range used by RTD to be more consistent with the anticipated operation of the PAR, which “tightened up some of the modeling assumptions to better reflect how it’s actually going to be operated,” LeeVanSchaick said.
Asked by Wentlent when the St. Lawrence PAR might be evaluated, LeeVanSchaick said he was not sure, “because those are complicated issues. Hopefully we can answer by the next quarterly report.”
Asked how the transmission build-up in the western part of the state would affect constraints, LeeVanSchaick said, “You might see more Ontario imports, which would hit hidden downstream bottlenecks, like perhaps Central East, but it’s not something that we’ve looked at carefully.”
Central East congestion increased primarily because of increased exports to New England from eastern New York, which were up approximately 400 MW, and more transmission outages leading to reduced transfer capability in April and May.
“Modeling these 115-kV constraints allows the market to reflect the congestion appropriately,” he said. “In the Hudson Valley-Dunwoodie category, we saw significant constraints, which is due to some new combined cycle natural gas generation in the Hudson Valley, and not as much energy being wheeled from the Hudson Valley through New Jersey to New York City.”
When the Indian Point nuclear plant retires in 2021, it will shift the location of congestion to another area south of the UPNY-SENY interface, LeeVanSchaick said.
New York City
NYISO’s efforts to manage constraints “have greatly reduced out-of-merit actions, especially in the West Zone,” LeeVanSchaick said.
However, most reliability commitments occur in New York City because additional generation is needed to satisfy operating reserve requirements that have not been reflected in the NYISO market, he said. On June 26, the ISO began to model city-wide requirements in the day-ahead and real-time markets.

Couch White attorney Kevin Lang, representing the city, questioned the extent to which market-based approaches would reduce the need to dispatch particular units in specific locations for reliability purposes.
“That’s a legitimate concern,” LeeVanSchaick said. “If you have higher energy and ancillary services prices, there’s going to be an decrease in uplift. … Generators should be able to earn more of what they need through providing those energy and ancillary services products.”
The ISO’s “granular operating reserves” project would define a set of locations so that the market is procuring what the system needs, he said.
“If we can shift investment toward areas where new resources provide real value in the day-ahead and real-time markets, it will be more efficient, even if the investment is driven by subsidies, and it will reduce the likelihood of needed [reliability-must-run] contracts,” LeeVanSchaick said. “Now is a particularly important time to have more efficient market signals.”