Environmental advocates decided over the last year or so to fight natural gas generation, notwithstanding the fundamental problems with relying only on renewables and batteries,1 and the fact that new natural gas, not renewables, is responsible for 90% of the reduction in carbon emissions in places like PJM.2
The latest salvo is Rocky Mountain Institute’s claim that the bulk of new natural gas generation is/will be uneconomic.3 Perhaps the advocates hope that if gas investment is scared off, then renewables and batteries become a fait accompli.4
RMI’s study has lots of assumptions and then presents conclusions. Numbers are lacking: It’s not possible to validate the data and algorithms. But we can discern at least two major flaws.
Coopting the Hypothetical Low-cost Resources
The first major flaw is that 40 to 50% of RMI’s “clean energy portfolio” (CEP) comes from demand response and energy efficiency. For the sake of argument, let’s go with RMI’s pixie dust assumption that 78.8 GW of new DR/EE resources are available at low cost (page 33).5
The problem with RMI’s approach is that it assumes these hypothetical low-cost resources are only available to its renewables/battery portfolio and not to a gas portfolio. So let’s say DR/EE resources cost $2, renewables/batteries cost $10 and gas costs $8. RMI’s approach effectively averages DR/EE’s $2 and renewables/batteries’ $10 to get $6 and says, aha, that is less than gas’ $8. But if you average DR/EE’s $2 and gas’ $8, you get $5, which is less than $6. Yes, it’s that simple.
The bottom line is that the economics that RMI attributes to its renewables/battery portfolio actually come from mixing in low-cost DR/EE that are not unique to that portfolio.
Much later in the report (page 39), we get an apples-to-apples comparison when RMI removes DR/EE from the renewables/battery portfolio. The result is that gas is more economic than renewables/batteries and remains so for a long time.
Supplying the Clean Energy Portfolio with Gas and Even More Coal
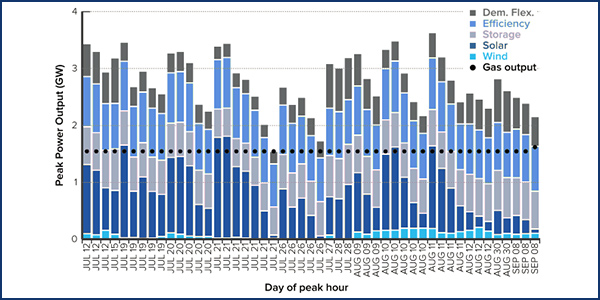
The second major flaw is a variation of the pixie dust problem I’ve written about before. This is apparent from examining RMI’s Figure 6 reprinted below:
Looking at the July 20 hours, storage is drawn down, and yet the next day, storage is assumed to start off fully charged to provide maximum capacity for the seven peak hours that day. Where did the electric energy come from to charge the batteries for July 21?
At one point (page 29), RMI says, “In all cases, the CEP generates the energy needed to charge the battery storage.” But on the next page, it says it is only considering (emphasis RMI’s) “the economics of marginal additions,” apparently meaning that traditional fossil generation is assumed to be recharging the batteries.6 Indeed, that is the only realistic possibility.
Putting aside the irony of traditional fossil generation supplying a “clean energy portfolio,” there is a dilemma. If new gas investment is scared off by RMI and others, then we’ll be looking at many years of the existing coal plants continuing to operate as they have in the past, with the added duty of battery recharging. The reduction in carbon emissions we’re seeing in places like PJM will come to a halt.
As they say, be careful what you wish for.
A Last Pixie Dust Note
A last note: Look again at Figure 6 above, and focus on the last hour of July 21. RMI is showing that the equivalent of a 1.5-GW gas generator would be matched by: zero wind and a negligible amount of solar; batteries charged with traditional fossil generation; and huge amounts of DR and EE, neither of which are unique to a renewables/battery scenario. In other words, renewables are contributing virtually nothing to matching the 1.5-GW gas generator.
Cue more pixie dust.
1- My most recent column is here, http://energy-counsel.com/docs/Cue-the-Pixie-Dust.pdf. I’ve written about the overall battery value proposition before, here http://energy-counsel.com/docs/Grid-Batteries-Kool-Aid-Once-More-with-Feeling-RTO-Insider-12-5-17.pdf, and here http://energy-counsel.com/docs/Battery-Storage-Drinking-the-Electric-Kool-Aid-Fortnightly-January-2016.pdf.
2- http://energy-counsel.com/docs/NRDC-Prescribes-More-Carbon-Emissions.pdf.
3- https://rmi.org/insight/clean-energy-portfolios-pipelines-and-plants.
4- The trade press certainly has taken the bait, e.g., “Gas Plants Will Get Crushed by Wind, Solar by 2035, Study Says,” https://www.bloomberg.com/news/articles/2019-09-09/gas-plants-will-get-crushed-by-wind-solar-by-2035-study-says.
5- New DR/EE resources often are forecasted as “potential” with no basis in reality. As an example of realistic DR forecasting, PJM projects an incremental 744 MW of DR over the next five years, which is 0.5% of peak demand. https://pjm.com/-/media/library/reports-notices/load-forecast/2019-rpm-load-forecast.ashx?la=en (pdf page 8). Of course, it’s always possible to hypothesize more DR/EE resources than what otherwise would be, but it’s ultimately a question of cost — creating 78.8 GW of incremental DR/EE resources couldn’t possibly be low cost.
6– This less-than-obvious meaning comes from an email exchange with one of the authors of the report.


