
 By Steve Huntoon
Recap
Six months ago, I discussed how PJM’s capacity market (the “Reliability Pricing Model”) reversed a deteriorating reserve margin, efficiently assuring resource adequacy years into the future while integrating demand response and renewable resources.[efn_note]http://energy-counsel.com/docs/Fuel-Security-PJM-Does-Seinfeld.pdf.[/efn_note]
RPM has been a bulwark against bailout claims for coal and nuclear units by enabling a transition from dirty coal and inefficient nuclear to cleaner natural gas and clean renewables. And the Capacity Performance refinement to RPM incents resources to be available when needed, further enhancing reliability.[efn_note]https://www.pjm.com/-/media/library/reports-notices/capacity-performance/20180620-capacity-performance-analysis.ashx?la=en (see for example conclusion at pdf page 34).[/efn_note]
Notwithstanding all this, the coal/nuclear bailout lobby created doubt about the “security” of generation resources that lack fuel on-site, i.e., natural gas generators without oil storage backup and, of course, renewable (intermittent) resources generally. This led to new buzzwords, “resiliency,” as something other than “reliability,” and resulted in a broad inquiry into “fuel security” at PJM.
Solution in Search of a Problem
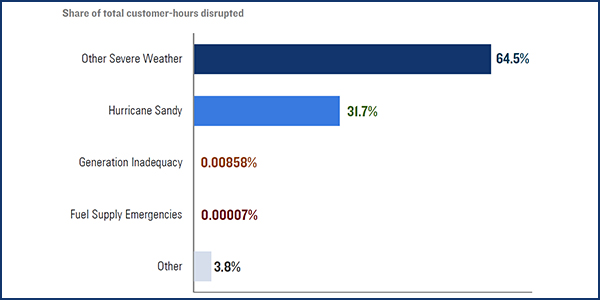
Once again let us put “fuel security” as a risk in historical context. Rhodium Group figured this out for us in 2017 and nobody has denied it:[efn_note]https://rhg.com/research/the-real-electricity-reliability-crisis-doe-nopr/ (emphasis added).[/efn_note]
“Between 2012 and 2016, there were roughly 3.4 billion customer-hours impacted by major electricity disruptions. Of that, 2,382 hours, or 0.00007% of the total, was due to fuel supply problems (Figure 1). Interestingly, 2,333 of those customer hours were due to one event in Northern Minnesota in 2014. And it involved a coal-fired power plant.”
Thanks again, Rhodium Group, for that great emperor-has-no-clothes exposé.

Creating a Problem
So how could there be a “fuel security” problem? PJM acknowledged last summer that there is no current problem. But it created worst-case scenarios for a potential problem in the future, say 2023-2024.
PJM created 324 scenarios, and in some of the most extreme, it found load shedding (outages) could occur.
In the worst of the worst-case scenarios, PJM found that there could be 83 hours of load shed for an average of 2,452.8 MW. Now, 83 hours sounds like a lot, but we need to remember that load/demand during this peak period is around 140,000 MW. So if load shed is spread across the system, it’s an average of 1.5 hours for any given customer.[efn_note]The math is 83 load-shed hours times average load shed of 2,452.8 MW divided by 140,000 MW of peak load.[/efn_note] So this worst of the worst-case scenarios was tiny.
Now, how likely was this worst of the worst-case scenarios to occur in any given year? For starters, it was based on a one-in-20-year extreme-winter condition. And it was based on a “high pipeline disruption,” meaning the entire loss of pipeline flow in a right of way. This is an extremely rare event and has never caused a major detrimental gas supply loss to PJM generation,[efn_note]Please see detail and supporting reference in footnote 5 of my prior column. By the way, contrary to a claim made at a PJM task force meeting in the summer, in the 1994 “cold wave,” firm customers were not curtailed because of loss of gas supply. This is shown on page 6 of this NERC report, https://www.nerc.com/pa/rrm/ea/February%202011%20Southwest%20Cold%20Weather%20Event/NERC%201994%20Cold%20Wave%20Report.pdf.[/efn_note] but being very conservative, one could assume a one-in-10-year chance of that both happening in PJM and happening in the winter. Now, what’s the chance of that disruption occurring at the same time as the extreme 14-day winter condition? About 1/6, because 14 days are about one-sixth of a three-month winter period.
OK, here’s the math: 1/20 x 1/10 x 1/6 = 1/1,200. Yes, once every 1,200 years, we might experience a tiny 1.5 hours of outage for the average PJM customer. As I said about this six months ago, we should live so long.
Flash Forward to the Latest PJM Analysis
Over the last six months, PJM has run more scenarios: 1,180,380 to be exact. And, the best I can make out, the bottom line is the same.
Where PJM (1) assumes a supply disruption that causes a generation loss of 10,000 MW,[efn_note]https://www.pjm.com/-/media/committees-groups/task-forces/fsstf/20191025/20191025-item-05-scenario-results-part-1.ashx (slide 49).[/efn_note] (2) assumes all 10,000 MW are lost for five days, (3) assumes this happens during a “cold snap” and (4) assumes its net capacity resources are lower by 15,300 MW from the future projected resource balance,[efn_note]https://www.pjm.com/-/media/library/reports-notices/fuel-security/2018-fuel-security-analysis.ashx?la=en (difference between 193,239 MW projected for 2023/24 year, and escalated retirement level of 177,906 MW).[/efn_note] PJM comes up with an expected load shed value for the top 5% worst-case scenarios of 264.51 MWh and an associated expected value of lost load (VOLL) cost of around $4 million.[efn_note]https://pjm.com/-/media/committees-groups/task-forces/fsstf/20191122/20191122-item-05-and-06-phase-2-summary-and-poll-questions-post-meeting.ashx (slides 11, 22, 28). By the way, PJM projects actual resources well above the target installed reserve margin for the next 10 years. https://pjm.com/~/media/committees-groups/committees/mc/20191031/20191031-item-01-2019-pjm-reserve-requirement-study-report.ashx (page 15, Table 1-4).[/efn_note]
Please note that the worst-case natural gas disruption is 4,945 MW (not 10,000 MW), for which the worst-case scenarios’ load shed is an even more trivial 10.4 MWh at an even more trivial VOLL cost of $156,000.
It’s difficult to aggregate all these remote possibilities into a single risk number, but somehow I think there’s a bigger chance of being hit by a meteorite.[efn_note]Which did actually happen to one person … once in all recorded history. https://www.nationalgeographic.com/news/2013/2/130220-russia-meteorite-ann-hodges-science-space-hit/[/efn_note]
And even then, the VOLL costs involved are trivial.
But Wait, There’s More
These tiny risks (and tiny costs) overstate the real risk because of mitigation factors (that are admittedly hard to quantify).[efn_note]More detail and supporting references are in my prior column.[/efn_note]
- Winter generation capability greater than summer capacity rating.
- Load reduction in response to what would be very high energy prices in the worst-case scenarios.
- Load reduction from public calls for voluntary conservation in the worst-case (emergency) scenarios.
- Import assistance from neighboring regions such as occurred during the polar vortex.
Much Ado About Not Much
After extensive work by PJM, I think we’re where we began. Tiny risks layered on top of one another with tiny costs under worst-case scenarios.
Oy vey.