By Robert Mullin
CAISO will likely be forced to curtail a massive amount of renewable energy this spring when increased solar output is expected to coincide with unusually “bountiful” conditions for hydroelectric production, the ISO’s top manager said.
“The last several years, the hydro system has been de-rated fairly significantly — [by] up to 4,000” MW, CEO Steve Berberich said during a Feb. 16 meeting of the ISO’s Board of Governors. “We’re going to see that flip and we’re going to have that 4,000 MW this year, plus we’ve added another couple thousand megawatts of solar.”
Last spring, CAISO confronted a number of instances when over-generation reached 2,500 MW, Berberich noted. In those cases, the ISO could “lay off” about 1,000 MW of the excess on the Energy Imbalance Market, while the rest was handled with decremental bids — otherwise known as economic curtailments.
Curtailments are expected to soar this year as the increase in solar capacity combines with high spring snowmelt to fuel possible record surpluses. California’s snowpack currently stands about 175% of normal, according to the state Department of Water Resources.
“We could see [over-generation] as high as 6,000 to 8,000 MW at a time, which will be the biggest over-generation that we’ve had,” Berberich said.
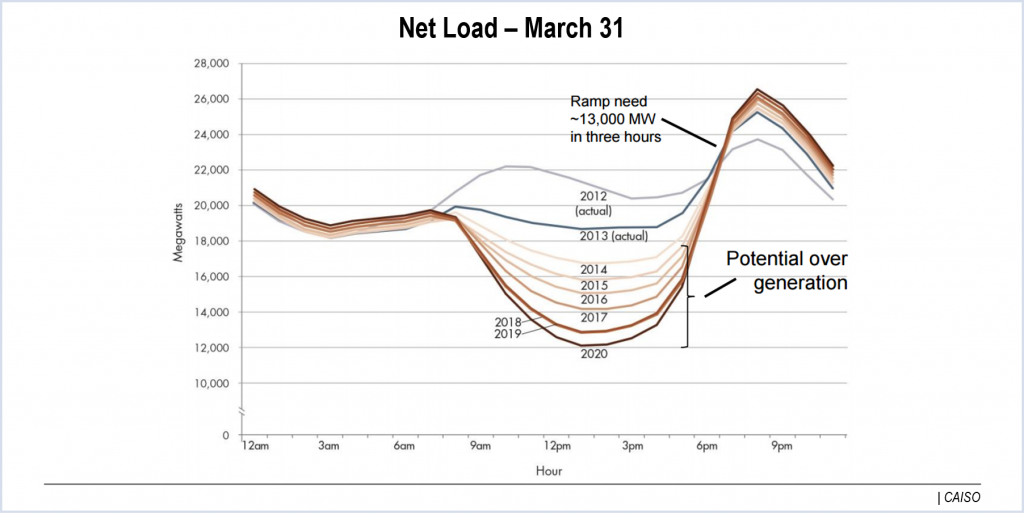
On a related note, Berberich reminded board members that CAISO’s “duck curve” forecast predicted that the ISO would be dealing with 13,000-MW solar-driven generation ramps in 2020.
“This last Sunday [Feb. 12], we blew through 15,000 MW,” Berberich said. “So we’re seeing this quicker and deeper than we expected and we’ll have to continue to monitor that.”
In 2013, CAISO published the California “duck curve” chart to illustrate the long-term impact of increased renewable penetration on its daily operations.
That forecast showed how the adoption of solar and other renewable resources would steadily undercut the ISO’s “net load,” which represents the portion of load being served by dispatchable resources such as gas-fired generation and imports.
Net load is calculated by subtracting the energy generated by variable renewable resources from total electricity demand. The curve turns sharply higher at sundown, indicating the need to rapidly ramp flexible resources to serve load.
A research report published last year by the ScottMadden consulting firm indicated that the “belly” of the curve was deepening more rapidly than originally predicted, with the corresponding ramping effects spread across the entire year and not just the typical spring day characterized by high renewable output depicted by the graph. (See Report: Calif. ‘Duck Curve’ Growing Faster than Expected.)


