By Michael Kuser
WESTBOROUGH, Mass. — Energy efficiency, lower economic growth and burgeoning home solar installations will reduce ISO-NE’s net load through at least 2026, Manager of Load Forecasting Jon Black said Wednesday.
While the region’s gross annual load is expected to rise by 8.5% to 152,593 GWh by 2026, load net of behind-the-meter solar and passive demand resources will drop 5.2% to 120,181 GWh. “There were no methodology changes in the [gross load] forecast since last year,” Black told the Planning Advisory Committee on March 22. “It’s just refreshes of the data.”

The region’s weather-normalized net electric consumption declined 1.5% in 2016 versus 2015, according to the RTO’s draft 2017 Capacity, Energy, Loads and Transmission energy and summer peak forecast. The completed forecast will be published by May 1.
Compared to last year’s forecast, the new report projects the 2025 annual energy demand will be 3.9% lower. The summer 50/50 forecast is approximately 3% lower, while the 90/10 forecast is 2.7% lower.

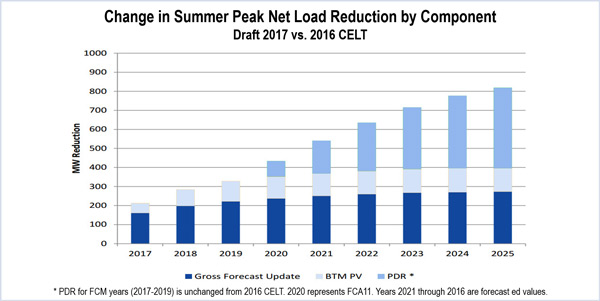
Reasons for the drop include a 15% increase over last year’s forecast in projected behind-the-meter solar for 2025 and an 11% increase in projected energy efficiency, the latter due to a revised production cost escalation methodology.
The grid operator projects approximately 2,444 MW of PV development over the coming decade, for a total of 4,362 MW in 2026.
Black said that they are now getting more granular data on load reduction because of PV after increasing the number of installations monitored from 1,200 to 9,000. The RTO counts distributed solar — those less than 5 MW — as reducing net load.
Passive demand resources climbed 11% last year to 14,380 GWh. Passive demand resources include the use of energy-efficient appliances and lighting, “smart” cooling and heating technologies that cycle air conditioners on and off, and measures to shift electricity use to off-peak hours.
Paul Peterson of Synapse Energy Economics asked RTO officials about the projected annual increases in PV resources. The report shows a 445-MW increase in 2017 PV versus 2016, a 23% jump.
“The PV is going to eat up large number of megawatt-hours. That will affect generation developers. If the pie continues to shrink, it becomes very difficult for generators to earn the same amount of revenue from energy sales,” Peterson said. “Generators need to know if solar will be five, six or eight thousand megawatts in 2026. Will the trend accelerate?”
“There’s a lot of uncertainty over that, around when this stuff becomes economic,” responded Black. “A lot depends on rate structuring. We’re waiting for clearer signals.”
ISO-NE officials told Vermont legislators in January that the capacity market “will be an important revenue-balancing mechanism to ensure resource adequacy as renewable resources drive down revenues in the energy market.”
Black said expectations of lower economic growth were based on a Moody’s Investor Service’s forecast that predicts New England’s share of the U.S. gross domestic product declining from more than 5.7% in 2000 to just more than 5% by 2026.