By Michael Brooks
Record warmth, combined with one of the largest increases in pipeline capacity in U.S. history, led to record-low gas prices last year, FERC said in its annual State of the Markets Report, released Thursday.
The 2015-2016 winter was the warmest on record for the continental U.S., with temperatures nearly 5 degrees above the 20th century average, according to the National Oceanic and Atmospheric Administration.
“Above average temperatures in the 2015-2016 winter limited natural gas demand during the first three months of the year, leading to robust storage inventories at the start of the 2016 injection season in April and reduced demand for storage injections through the summer,” FERC said. “Prices fell to record lows in the first half of 2016, before climbing thorough the second half of the year driven by steady domestic demand, rising exports and a drop in production.”

Henry Hub prices averaged $2.48/MMBtu, the lowest in 20 years and a 5% decrease from 2015. While prices fell across the country in 2016, the Northeast saw the most dramatic decreases, with New York City prices falling 42%. The region, however, saw a spike in prices last month. (See related story, Gas, LMPs Rebound in NY, New England in March.)
The low prices are made even more notable by the fall in supply. Gas production fell 2.5% last year, averaging 72.3 Bcfd, as overall domestic demand only rose 1% to 75.6 Bcfd. This was the first year-over-year drop in production since 2005, FERC said. However, the commission expects that production will rebound this year, “driven by a projected 26% increase in oil and gas exploration and production investment,” it said.

Prices will also remain low this year, the report said, because of the amount of new pipeline capacity. 2016 saw 7.1 Bcf go into service, and more projects are expected this year, with three into Mexico. Exports to the country grew 24% to 3.6 Bcfd, marking the sixth year in a row they have increased.
Storage withdrawals at the beginning of the year totaled 1.8 Tcf, the lowest in four years, and as a result, inventories stood at 2.5 Tcf in April, a record high. Inventories set another record at the end of the injection season as well, with 4.047 Tcf in storage in November.
Because winter 2016/17 was not quite as warm as 2015/16, gas demand from residential and commercial increased by 12% in December, compared to the same month in 2015. However, this winter made headlines for its brevity, with February 2017 being the second-warmest February on record. Last month, the Energy Information Administration reported the first-ever gas injection in February.
Gas Overtakes Coal; Renewables Continue Gains
While gas demand from the residential and commercial sectors fell 5.1%, this was partially offset by a 4% increase from power generators. 2016 was a landmark: While gas’ growth slowed (demand increased by 17% in 2015), it became the primary source of electricity generation nationally in 2016, the first time ever on an annual basis, according to EIA data. Gas generated 34% of U.S. electricity, compared to 30% from coal.
The U.S. added more than 27 GW of generating capacity in 2016, according to EIA. About a third of this were new natural gas plants, while about 10 GW of coal plants retired.
Most of the remaining additions were utility-scale renewable resources. The U.S. added 8.7 GW of wind and 7.7 GW of solar in 2016, according to EIA. The commission said renewables were buoyed by the extensions of the production and investment tax credits, as well as several increases in state renewable portfolio standards.

Additionally, despite the retirement of the 478-MW Fort Calhoun nuclear plant in October, the completion of Watts Bar Unit 2 that same month led to a slight net increase for nuclear capacity. FERC expects the increase to be short-lived, however, as numerous plants are expected to retire in the next few years. The fate of two under-construction plants in the Southeast are in doubt following the bankruptcy of Westinghouse Electric last month.
Net Metering Contributing to Low Electricity Demand, Prices
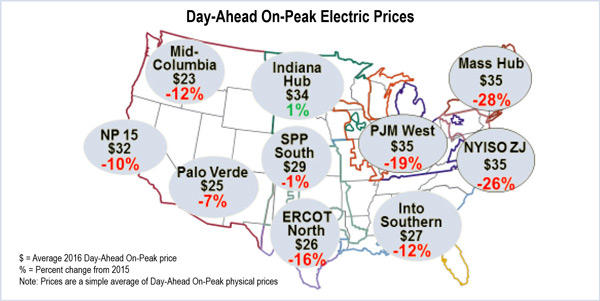
Thanks largely to cheap gas, power prices were down across most of the country, with PJM recording the lowest LMPs since the RTO’s formation in 1999. (See PJM Monitor Concerned About State Subsidies.) Like gas prices, New York and New England saw the biggest drop.
Total electricity sales fell 13% from 2015, even as the U.S. economy experienced steady growth. FERC attributed this to the warm winter and increased energy efficiency.
The commission also noted that net metering from rooftop solar is reducing demand for wholesale power. According to EIA, distributed solar capacity increased by 3.4 GW last year.
“Although net-metered projects largely participate in retail markets, their aggregate impact has begun to affect wholesale markets with large penetration of distributed solar projects,” FERC said. “These impacts can largely be seen as a functional reduction on demand from the RTO/ISO perspective, with subsequent shifting of system load curves.”