By Robert Mullin
CAISO is curtailing an increasing volume of renewable generation this spring as the ISO sees its “duck curve” already dipping to levels not forecast to occur until 2021.
Compounding the issue is an unusually high snowpack coming after years of drought that had previously undercut California’s hydroelectric output, making more room for solar.
“Everything’s kind of playing out the way we had expected, maybe just a little bit faster,” Mark Rothleder, the ISO’s vice president for market quality and renewable integration, said during an April 19 meeting of the Energy Imbalance Market (EIM) Governing Body.
All-Time Low
“We’ve seen net load levels of 10,386 MW” — an all-time low, Rothleder said. “This is about four years ahead of the schedule of where we expected to be” when the ISO first introduced the duck curve in 2013.
“Net load” represents system load minus the combined output from utility-scale wind and solar resources. The ISO cares about those three components because they all represent variable factors, Rothleder explained. Where system operators once had to track and balance only load, they must now deploy dispatchable resources to balance whatever portion of the load is not being served by renewables.
The all-time-low net load figure cited by Rothleder occurred on April 9. It was also off the charts of the original graph, which only forecasted out to 2021 (see graph).
“When we put the duck out a few years ago, we probably didn’t factor in the effects of behind-the-meter solar as much as we’re actually seeing play out,” Rothleder said.
CAISO estimates that its balancing authority area contains about 5,000 MW of rooftop solar capacity, which reduces system load during daylight hours.
Rothleder pointed out that the duck curve is also intended to illustrate the sharp daily ramps needed from dispatchable resources as solar output starts to wane as residential load ticks upward in the evening. In December, the ISO observed a 13,000-MW three-hour ramp about four years ahead of expectations.
Deeper, Longer, Steeper
“Looking forward, we should continue to expect that the belly of the duck is going to get deeper and that the evening ramps will get longer and steeper as well,” Rothleder said.
At about 11,000 MW of net load, the ISO has “to start stacking up what other supply is already on the system that you can’t move,” Rothleder explained. In California, that means about 2,000 MW of nuclear, 1,000 MW of qualifying facilities under the Public Utility Regulatory Policies Act and — “in a good year” — around 6,000 MW of hydroelectric output.
With snowpack levels in the Sierra Nevada mountains currently at about 180% of normal, and California’s drought officially declared over, this is a very good year for hydro.
In leaner times, the steady growth of California’s solar capacity conveniently substituted for the decline in hydro, Rothleder said. Now the two must compete, with hydro curtailments limited by flood control needs and environmental restrictions on spilling water over dams.
“You’re now getting into a condition where you have an excess amount of energy and you have to do something with it,” Rothleder said.
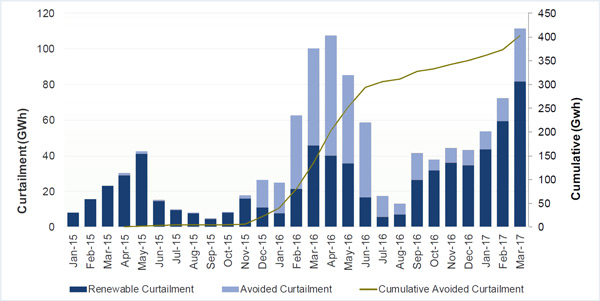
One key response has been exporting to neighboring BAAs through the EIM, which last month helped the ISO avoid more than 100 GWh of renewable curtailments.
“And if we run out of that ability, we effectively get to the point where we have to curtail, whether it be economic curtailment through bids on the wind and solar resources to dispatch down, or manual curtailment because we ran out of bids,” he said.
80 GWh Curtailed in March
CAISO curtailed about 80 GWh of renewable generation in March, nearly double the curtailments during the same month last year. So far this year, curtailments have occurred in 31% of all five-minute dispatch intervals, compared with 21% last year and 16% in 2015, the ISO estimates.
EIM Governing Body member Valerie Fong asked how the curtailments were allocated across the ISO’s market.
“It’s not an allocation,” Rothleder replied. Rather, resources are curtailed based on what price they offer into the market. Renewable resources frequently bid in at negative prices because of other compensation derived from renewable energy certificates and tax credits.
“The one that’s bidding -$15 will be dispatched down first before [a resource bidding] -$30,” Rothleder said.
Is Storage an Answer?
Body Chair Kristine Schmidt asked whether there were any developments related to energy storage that could help reduce curtailments.
Rothleder said “the proposition of storage is an ongoing question” in which CAISO market participants must determine when curtailments reach a level that warrants investment in “higher-cost” storage solutions.
“When does that threshold get crossed? I don’t think we’re there at the current levels” of curtailments, Rothleder said.
Sara Edmonds, general counsel with PacifiCorp Transmission, pointed out that the ISO’s own numbers show that curtailment avoidance through the EIM this year is lower than last (see graph).
“I’m still trying to understand that myself,” Rothleder said. “There could be various reasons.”
One potential reason is that supply conditions across the West are different from previous years, with snowpack high in other regions as well.
A second possibility: EIM participants could be changing the way they deploy resources, reducing the potential for downward dispatch in their own balancing areas.
A third: The inclusion of Arizona Public Service and Puget Sound Energy in the EIM last October could be altering the dynamic of the market.
“So I don’t have the full explanation,” Rothleder said. “I think we’ll see how things continue to play out over the rest of the spring and summer — and especially with other hydro conditions throughout the West.”


