")
A new report released Tuesday by the American Council on Renewable Energy (ACORE) calls the potential of the proposed Southeast Energy Exchange Market (SEEM) into question, asserting that other models surpass the benefits promised by SEEM’s proponents.
The report, titled Maximizing Cost Savings and Emission Reductions: Power Market Options for the Southeast United States, was produced for ACORE by Vibrant Clean Energy (VCE), a developer of software modeling, planning and optimization tools with a focus on solar and wind energy. It reviewed a study comparing four separate scenarios for a future energy market in the footprint of the SEEM proposal:
- SEEM as planned by its proponents: The utilities and cooperatives participating in SEEM, which include Southern Co. (NYSE:SO), Duke Energy (NYSE:DUK) and the Tennessee Valley Authority, claim that expanding bilateral trading in 11 Southeastern states will reduce trading friction while promoting the integration of renewable resources.
- An energy imbalance market (EIM) set up to optimize capacity expansion through the least expensive combination of thermal and renewable energy generation, storage and transmission. Balancing authorities are required to meet their planning reserves within their footprints but can use energy transfers between regions for their planning reserve requirements.
- An RTO in which “every balancing region undergoes optimal capacity expansion, ensuring the footprint as a whole meets their planning reserve requirements on their coincident load.”
- An RTO with the same assumptions as the previous model, but in which utilities also set a common goal to reduce electricity sector carbon emissions by 98.5% by 2040.
All four scenarios were run over the same time frame, starting in 2020 and ending in 2040. VCE compared the four scenarios on the basis of cost savings, as well as reductions in carbon emissions, using its Weather-Informed energy Systems: for design, operations and markets-Planning (WIS:dom-P) software to model the outcomes.
All Scenarios Outperform SEEM
While all scenarios showed positive results in both categories, changes under SEEM were more modest than any of the others. In VCE’s model, adopting SEEM caused total resource costs to drop from $64.7 billion in 2020 to $53.1 billion in 2040. Meanwhile, carbon emissions in 2040 were 30% below 2020 levels under SEEM; carbon dioxide emissions from the electric sector for the studied period were slightly below 3.4 million metric tons.
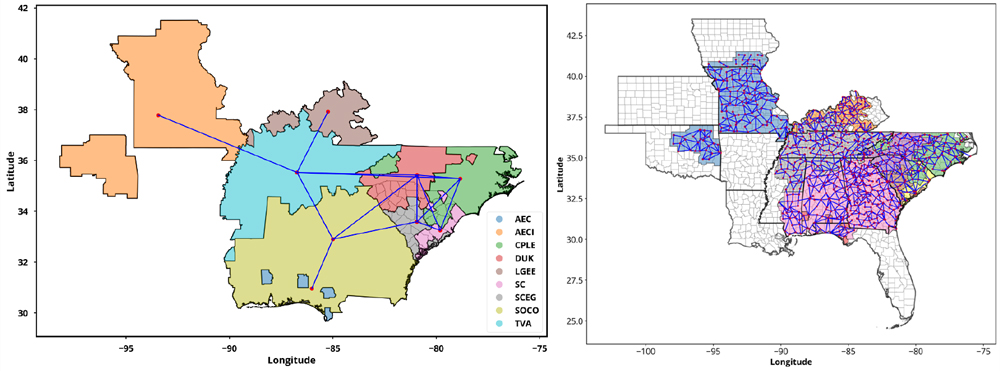 Inter-region bulk transmission and county-level transmission topology for the SEEM region | ACORE
By comparison, all the other scenarios projected significantly more aggressive cost reductions than the SEEM proposal. The EIM performed best in terms of total resource costs, which fell to $42.1 billion by 2040 under VCE’s model. Resource costs for the RTO were around the same level, while the RTO with decarbonization (RTO+Decarb) was just under $50 billion. The RTO showed the greatest cumulative savings with $119 billion saved over 20 years compared to SEEM; EIM saved $111 billion over SEEM; and RTO+Decarb saved $103 billion.
According to VCE, the EIM scenario saw the greatest reduction in resource cost because of performing “optimal capacity expansion and [counting] the energy transfers between the balancing areas towards the planning reserve.” This is despite EIM actually trailing the two RTO scenarios in the first 10 years of the model because it “retires the fossil generation slower than the ‘RTO’ [scenarios] and therefore results in higher system costs.”
Becuase the RTO outperforms the EIM for the first 10 years, it has a slight edge in cumulative savings. The RTO+Decarb scenario displays similar resource cost reductions to the base RTO until 2034, when large investments in variable renewable generation are needed to reach decarbonization goals.
RTO+Decarb Clear Emissions Winner
While the EIM scenario delays full retirement of fossil fuels compared to the RTO scenarios, SEEM does not do so at all: VCE’s model shows more than 100 GW of installed coal and natural gas capacity by 2040 under SEEM, compared to around 70 GW of natural gas for EIM and base RTO — without any coal — and around 20 GW of gas generation under RTO+Decarb. The EIM, RTO and RTO+Decarb scenarios all see significant expansion of renewable generation as well, especially the latter with nearly 400 GW of renewables in 2040, compared to around 200 GW each for the other two.
Investments in storage under the non-SEEM scenarios also dwarf that under SEEM, with about 10,000 MW of storage capacity installed in 2040 under SEEM (about double 2020 levels). By the same year, EIM and RTO have about 90,000 and 100,000 MW of storage capacity installed, respectively, while RTO+Decarb has about 65,000 MW.
This replacement of fossil fuel generation with renewables and storage means that the non-SEEM scenarios see substantial reductions in emissions over the 20 years of the study. Compared to SEEM’s 3,362 million metric tons (mmT) emitted by 2040, the EIM shows 2,614 mmT emitted over the same time frame and the RTO shows 2,560.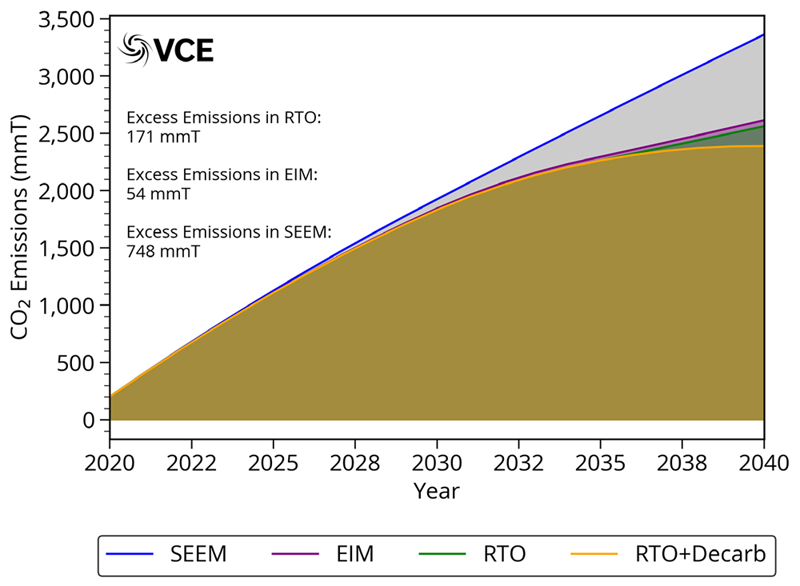 Cumulative electric sector carbon emissions in the scenarios modeled | ACORE
The RTO+Decarb scenario shows the greatest reduction in carbon dioxide emissions, as might be expected from its explicit focus on decarbonization. Under this template, cumulative emissions fall to 2,389 mmT, representing the end of virtually all carbon emissions. VCE’s model only accounts for existing techniques for carbon reduction, so new technologies such as carbon sequestration could see the atmospheric carbon reduced even further.
RTO+Decarb is also notable for nearly eliminating all other air pollutants tracked by VCE’s model, including sulfur dioxide, nitrogen oxides, and carbon hexafluoride, all of which are still present in significant amounts by 2040 under SEEM. While the EIM and RTO both see all pollutants except nitrogen oxides reduced to near zero, RTO+Decarb is the only scenario where NOx is also almost completely gone.
ACORE’s report could lend ammunition to critics of SEEM that have warned FERC to exercise skepticism about the promises of the proposal’s supporters (ER21-1111, et al.). Most recently a group of Democratic lawmakers in North Carolina wrote the commission calling for a technical conference to investigate other Southeast market organization proposals, including an RTO or EIM. (See NC Legislators Join Call for Southeast Technical Conference.)