Rising natural gas prices and extreme weather pushed wholesale electricity prices higher in 2021, FERC said Thursday in its State of the Markets report.
Commission staff said changes in fossil fuel markets “drove price increases” across the board, including for natural gas, oil, propane and electricity, reversing trends of flat to declining prices for several years.
Henry Hub spot gas prices averaged $3.82/MMBtu in 2021, compared with $1.99/MMBtu in 2020. And gas prices have continued to increase in 2022, averaging $4.54/MMBtu through March 14.
Average day-ahead peak prices increased last year at pricing hubs in each RTO and ISO, FERC said, up more than 45% on average and more than 100% in ISO-NE and NYISO. Commission staff said “stressed market conditions” during the February 2021 winter storm in ERCOT, MISO and SPP led to high prices that raised the average for the year.
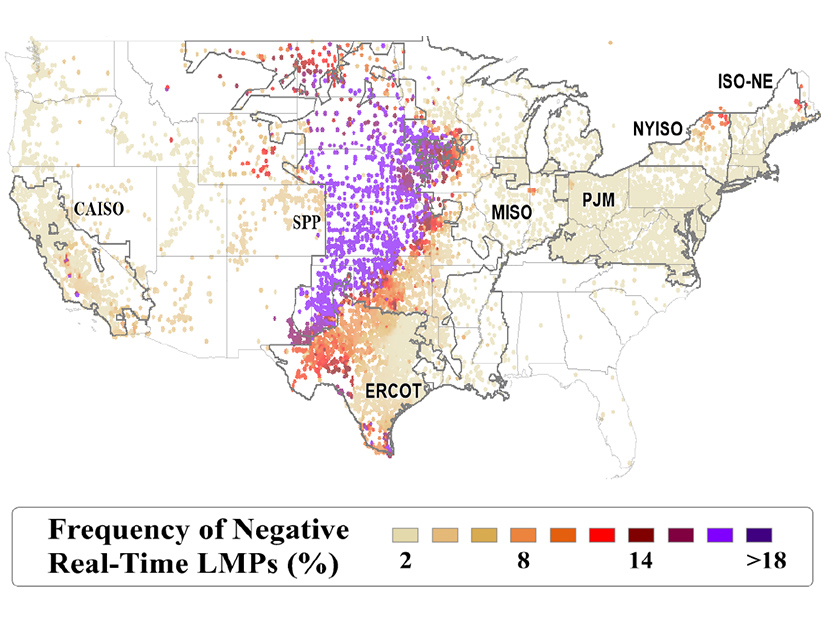
Despite rising prices, FERC said, instances of negative prices in real-time markets continued to increase across various regions. In 2021, negative average hourly real-time LMPs occurred in about 3.5% of all hours across all RTO/ISO pricing points, compared with 3.1% in 2020.
SPP’s negative prices averaged -$15/MWh over the year, and the RTO accounted for 41% of negative LMPs across all markets, the result of high wind output and low demand, as wind’s share of total output jumped to 34% from 27% a year earlier. ERCOT accounted for 29% of negative prices at an average of -$12/MWh, while CAISO’s share was 21% at an average of $-15/MWh.
Generation Sources
Commission staff said higher natural gas prices also “increased the relative competitiveness” of coal-fired generation, with coal output rising 20% despite continued unit retirements.
Across the RTOs/ISOs, the share of coal-fired output increased from 21% to 24%, while gas-fired generation decreased from 38% to 35%.
Generating capacity continued recent trends, as aggregate nameplate generating capacity grew from 768 GW in 2020 to 789 GW across all RTOs/ISOs. As of December, natural gas represented 46% of the capacity mix, followed by coal at 18%, wind at 14%, and nuclear at 8%.
FERC said some RTOs/ISOs experienced “relatively large changes” in capacity mixes, including an increase in battery storage capacity in CAISO from 0.7% to 3.2% of its capacity mix, an increase in wind capacity in SPP from 26.8% to 29.5% and solar capacity in ERCOT rising from 4.1% to 7%.
The largest portion of capacity retirements came from coal, the commission said, although the 6.5 GW of retirements in 2021 was the lowest number since 2014. FERC said the decline was partly driven by increased electricity demand and the higher natural gas prices.
Electric Transmission
About $15 billion of transmission projects came online in 2021, FERC said, with more than 1,000 line-related transmission projects entering service in the Eastern and Western interconnections. The commission said about one-fifth of the projects included new lines, and about a quarter of those projects were at or above 230 kV.
FERC highlighted the Western Spirit project, a 155-mile 345 kV line in New Mexico, costing $360 million and connecting more than 1,000 MW of generation in the state to the electricity grid operated by Public Service Company of New Mexico. The line was the largest new high-voltage transmission project and the only merchant transmission line to enter service in 2021.
The commission said Order 1000 transmission planning in each region “worked towards or completed a regional transmission plan” in 2021. CAISO’s 2020-21 transmission plan identified three reliability-driven transmission projects estimated at less than $5 million, and two other transmission projects that could be replaced with battery storage. SPP identified 28 new projects with a total of 397 miles of new lines and 48 miles of rebuilt lines, costing $1 billion.
MISO identified 335 new transmission projects totaling 1,188 miles of new lines and 3,137 miles of upgraded lines, costing $3 billion.
PJM added to its Regional Transmission Expansion Plan with 118 new baseline transmission projects at an estimated cost of $920 million and 34 new network transmission projects at an estimated $48 million. Of the new baseline transmission projects, 52% were driven by transmission violations, 23% by generator deactivations and 25% by other NERC and PJM reliability criteria.
Electric Interconnection Queues
The commission said a changing resource mix with increasing renewables has made delays in generation interconnection queues a “persistent, growing feature” of the markets.
“There has been an unprecedented volume of requests to interconnect new generating facilities, which, in turn, has led to backlogs and delays in interconnection queues nationwide,” FERC said in its report.
The RTOs/ISOs had 716,783 MW in interconnection queues at the end of 2021. Solar accounted for the largest portion (282,978 MW), followed by batteries (216,426 MW), wind (114,634 MW), hybrid resources (41,873 MW), DC transmission (19,620 MW), natural gas (9,972 MW), thermal (6,034 MW), combined cycle (4,804 MW), hydro (2,958 MW) and steam turbines (1,119 MW).
Of all the regions, CAISO had the largest amount of capacity by megawatts in its interconnection queue, with solar and batteries as the most common resource types. PJM had the second largest queue by capacity volume, with solar and batteries also comprising the largest shares.


