Like solar, wind generation in the U.S. faces a challenge of rising penetration and falling value on the grid.
Wind energy power purchase agreement prices are still trending below natural gas prices, according to the Department of Energy’s 2022 Land-Based Wind Market Report. But “the regions with the highest wind penetrations (SPP at 35%, ERCOT at 24% and MISO at 12%) have generally experienced the largest reduction in wind’s value relative to average wholesale prices,” the report says.
For example, the wholesale market value of wind in SPP in 2021 was $19/MWh versus $46/MWh for “24/7 flat profile” generation.
DOE released three wind energy market reports on Aug. 16 — one each on land-based, offshore and distributed resources — which together provide a view of the push and pull of forces now shaping the growth of the industry in the U.S.
The land-based report shows that while the solar industry is addressing intermittency issues with a growing number of hybrid solar and storage deployments — 67 new projects in 2021 — only two wind-and-storage projects were added to the grid last year.
Further, wind-and-storage hybrids are not providing the same capacity and flexibility as solar-and-storage. “The average storage duration of these [hybrid wind] projects is 0.6 hours, suggesting a focus on ancillary services and limited capacity to shift large amounts of energy across time,” the report says.
Offshore
A similar push-and-pull can be seen in the unprecedented $4.37 billion paid for six offshore wind leases in the New York Bight auction in February. While the sale was widely seen as demonstrating the intense interest in offshore development, it also triggered concerns about the impact of those high prices — estimated at $763/kW — on consumers’ electricity bills, according to DOE’s 2022 Offshore Wind Energy Market Report. (See Fierce Bidding Pushes NY Bight Auction to $4.37 Billion.)
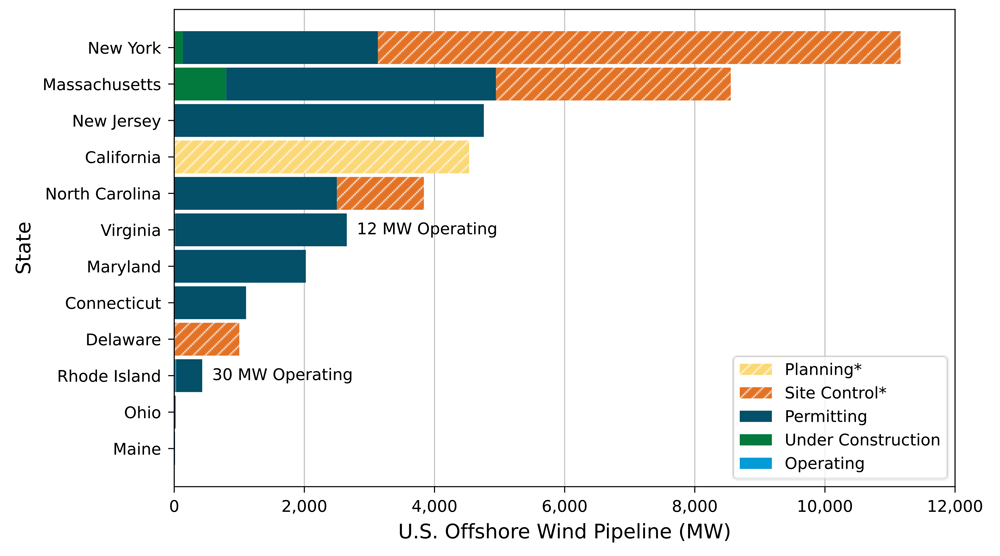 Capacity for “Permitting” and “Site Control” categories are assigned to the state where the wind energy area (WEA) is geographically located. All other categories are assigned to the state where the power will be delivered. | DOE
In response, the U.S. Bureau of Ocean Energy Management changed the auction rules for its May offshore auction, for two sites off the coast of the Carolinas, which sold for a modest combined total of $315 million. (See North Carolina OSW Auction Nets $315 Million.)
The “multifactor” bidding rules discounted prices by providing credits for up to 20% of the total sale amount to bidders committing to workforce or supply chain development as part of their projects. A similar multifactor approach will be used for upcoming Pacific Coast offshore wind auctions, the report says.
Driving down costs will be a continuing challenge for offshore wind, with DOE reporting global levelized costs for fixed-bottom projects in 2021 ranging from $75/MWh to $116/MWh, versus a U.S. average of $32/MWh for onshore wind. Adding to cost pressures in the U.S., the report says, “the [offshore] industry will need to tackle new technical challenges, such as hurricane survival, deeper water and lower average wind speeds.”
Onshore
While the U.S. onshore wind market continues to grow, with a total capacity of 136 GW by the end of 2021, the country still lags behind a number of European countries — including Denmark, Spain, Germany and the U.K. — which each get more than 20% of their power from wind.
2021 was also a year of contraction for the U.S. market, according to the land-based report. New onshore capacity grew by 13.4 GW last year — a 20% drop from the 16.8 GW installed in 2020 — but still enough to keep wind as the second-largest source of new generation on the U.S. grid. Solar was No. 1 at 45% of new generation with wind power following at 32%.
The domestic supply chain also contracted, with blade manufacturing taking a 50% nosedive as three U.S. manufacturing plants closed or idled, the report says. Like the solar and storage industries, wind relies heavily on imports, which were worth $3.1 billion last year, with Mexico, Spain and India the country’s key suppliers.
The U.S. market also relies on four turbine manufacturers, with only one — General Electric — homegrown, according to DOE. The others are Vestas, Siemens Gamesa Renewable Energy and Nordex.
Like solar, domestic wind is being slowed by projects caught in RTO and ISO interconnection queues. DOE reports 247 GW of wind are currently waiting for interconnection.
More promising, in terms of future growth, the market is diversifying in terms of who owns, sells or is buying wind-generated power. Utilities accounted for 44% of new wind power on the grid last year, but direct retail purchasers, including corporations, were close behind, with 35%. Merchant or quasi-merchant projects, with revenues tied to short-term contracts or wholesale spot markets, made up another 7%.
Distributed Wind Energy
DOE also reported its latest data on the distributed wind energy fleet, which totals 89,000 turbines with a nameplate capacity of 1,075 MW.
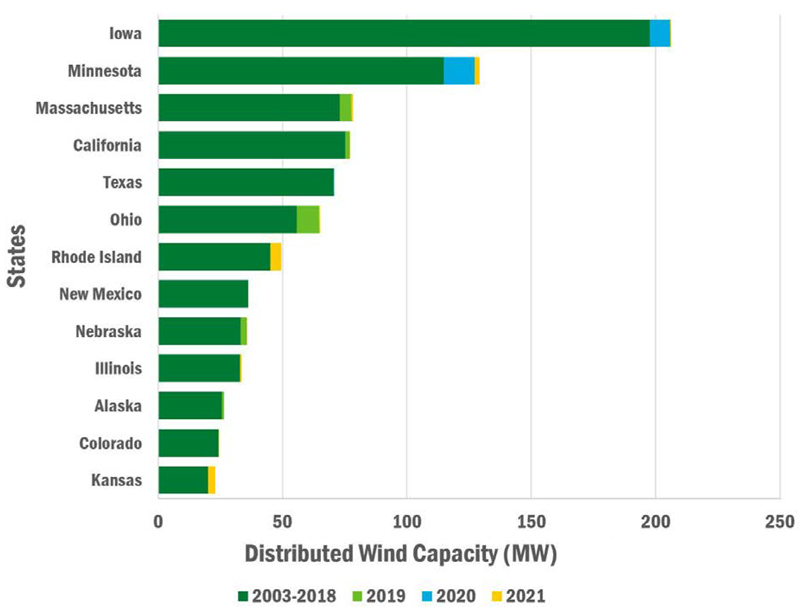 Iowa and Minnesota, which have strong wind resources and active project developers, have received a significant number of U.S. Department of Agriculture Rural Energy for America Program wind grants, DOE says. | DOE
In 2021, 15 states added 1,751 turbines totaling 11.7 MW, representing a $41 million investment, about 75% of which was installed in Rhode Island, Kansas and Minnesota. That was a drop from the 21.9 MW ($44 million) added in 2020 and 20.4 MW ($59 million) added in 2019.
Of the 11.7 MW added last year, 8.7 MW came from projects using large-scale turbines (greater than 1 MW), while 1.2 MW came from mid-sized turbines (101 kW to 1 MW) and 1.8 MW came from small wind turbines (up to 100 kW). DOE said small turbine manufacturers are reporting that potential customers are increasingly expressing interest in microgrids or hybrid systems.
Distributed wind energy caters to a diverse group of customers, including military operations, municipal water systems, prisons, parks and tribal governments. In 2021, utility customers accounted for 56% of the total distributed wind capacity, while agricultural customers accounted for 56% of the total number of new projects installed. Between 2012 and 2021, 90% of the distributed wind projects were interconnected for on-site use, while the remaining 10% served local loads on distribution systems.
Although distributed wind occupies a tiny niche now, the National Renewable Energy Laboratory’s Distributed Wind Energy Future Study says it has an economic potential of 919 GW behind the meter and 474 GW in front of the meter.
“The projections increase substantially in a 2035 scenario that includes more policy support, namely the extension of the federal investment tax credit and relaxed siting conditions,” DOE said.