

PJM capacity prices dropped in much of the RTO for delivery year 2024/25, but ratepayers in five regions will face increases due to locational constraints.
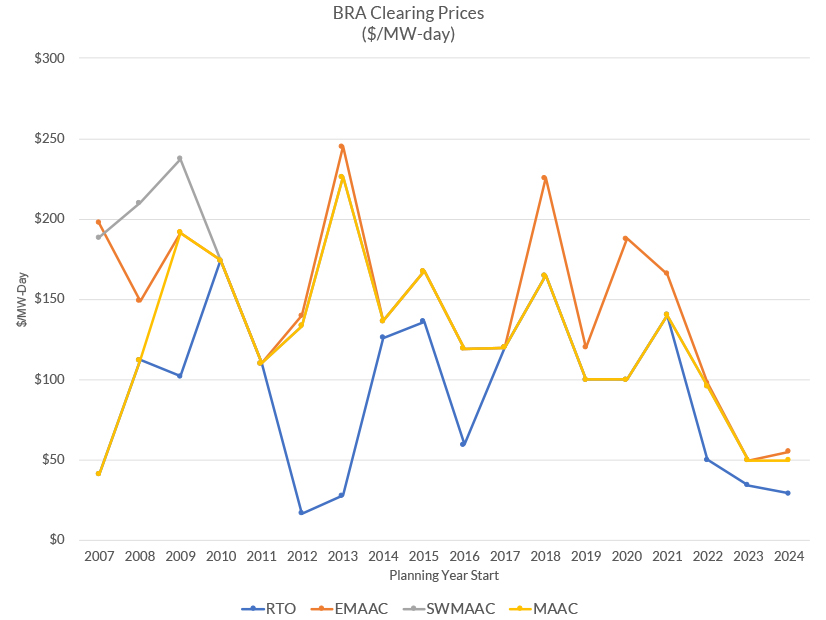
PJM said its overall capacity bill will be unchanged at $2.2 billion as prices in the “rest-of-RTO” dropped 18% to $28.92/MW-day from $34.13 for 2023/24. But prices in the Base Residual Auction were considerably higher in five regions, an increase from three regions that saw price separation in the previous auction:
- DEOK (Duke Energy Ohio and Duke Energy Kentucky): $96.24;
- DPL-South (Delmarva Power south of Chesapeake & Delaware Canal): $90.64;
- MAAC (Met Ed, Penelec, Pepco, PPL): $49.49;
- Eastern MAAC (Atlantic City Electric, Delmarva Power North, Jersey Central Power & Light, PECO, PSE&G, and Rockland Electric): $54.95; and
- BGE (Baltimore Gas and Electric): $73.
Constrained LDAs
“We continue to see indications that … some locational deliverability areas are increasingly constrained,” PJM Senior Vice President of Market Services Stu Bresler said in a press conference after the results were released Monday afternoon.
“The congestion is really due to the combination of the available transmission into the locational deliverability area, along with the available resources and the offer prices of those resources in those constrained LDAs,” Bresler said. “It’s really an indication that we need to commit higher cost resources there than we did in the rest of … the RTO, in order to maintain reliability. So it’s not necessarily an indication that we are or will be short, in that area. Certainly none of these LDAs got anywhere close to the maximum price on the demand curve.”
While none of the LDAs were near the maximum price cap in each of the zones’ variable resource rate (VRR) curve, the report notes that all five had less than 5% supply offered in excess of the megawatts that cleared the auction.
 PJM capacity prices by delivery year | © RTO Insider LLC, from PJM data
PJM said prices in DPL-South would have been four times higher had FERC not accepted the RTO’s proposal to address a “mismatch” between the resources included in the calculation of the LDA’s reliability requirement and those that entered the auction.
Supporters of the proposal, largely public utilities and state advocates, said it protected ratepayers while keeping the market in line with supply and demand, while generation owners decried the order as undermining confidence in the markets and a violation of rules against retroactive ratemaking. (See FERC OKs PJM Proposal to Revise Capacity Auction Rules.)
‘Healthy’ Margin vs. Retirement Concerns
Although the RTO said it will maintain a “healthy” reserve margin at 20.4%, officials expressed concern at a 2,198-MW drop in offered capacity, the third year in a row that saw a reduction. Bresler said the reduction in offered supply was almost all comprised of fossil fuel units, mostly coal-fired generation, which saw a 2,050-MW decrease in offers. Demand response, hydro and wind saw more modest declines.
“If this trend continues, it represents a potential concern for long-term resource adequacy, depending on the rate of replacement of these resources,” PJM said.
A white paper published by PJM last week warned of reliability problems within a few years if the pace of generation interconnections does not increase to match deactivations. The report states that approximately 40 GW of generation is expected to retire by 2030, while as little as 15 GW is projected to be installed at the current trajectory. The PJM Board of Managers concurrently announced that it has initiated a fast-track rulemaking process to find solutions to address the reliability concerns. (See PJM Board Initiates Fast-track Process to Address Reliability.)
Energy Market Impact
Bresler said the reduced prices in rest-of-RTO reflected higher energy market revenues driven by higher gas, oil and coal prices.
“So you would expect to see lower capacity market offers,” he said. “But we do remain concerned about market sellers’ ability to include risk in their capacity market offers, particularly learning from the events of December 23rd and 24th, where there were … quite a few performance assessment intervals, and therefore penalties that will apply to capacity resources that failed to perform.” (See PJM Gas Generator Failures Eyed in Elliott Storm Review.)
The auction results may have also been impacted by a “marginally higher” net cost of new entry used to determine the VRR curve, according to PJM’s auction report. The figure rose from 6.2% to 7.2% in the 2024/25 BRA. The RTO’s reliability requirement also increased by 236 MW up to 132,056, although the report notes there were “significant” changes to the requirement for LDAs.
“While the auction’s low capacity clearing price represents savings for customers in the short term, we continue to sound the alarm when it comes to the reality that critical generation resources needed to secure reliable electricity … are at risk of retirement,” the Electric Power Supply Association (EPSA) said in a statement after the results were announced. “The market must be designed properly and avoid rule changes intended to accommodate specific preferred resources or technologies. EPSA has long called on PJM leadership, policymakers, and regulators to address the serious foundational issues at hand, and we stand ready to continue to provide recommendations and work collaboratively to forge a solution.”
Winners, Losers
PJM procured 140,416 MW of capacity, excluding energy efficiency resources, whose impact is reflected in a lower load forecast. Fixed resource requirement (FRR) capacity plans — load-serving entities that choose to provide their own resources outside of the BRA — added 32,545 MW for a total of 172,961 MW.
Including FRR resources, PJM saw increases in cleared capacity for natural gas (+1,615 MW) and solar (+1,297 MW). Energy efficiency cleared or committed in an FRR plan increased by 2,198 MW.
In contrast, demand response (-451 MW), nuclear (-331 MW), coal (-278 MW), hydro (-237 MW) and oil (-230 MW) cleared less than in the prior auction.
New generation cleared 328.5 MW in the BRA, while an additional 173.8 MW capacity was procured from uprates to existing or planned generation, which Bresler said was a “fairly significant reduction in offers from new or upgraded generation” compared with the approximately 3,000 MW that cleared in the previous auction.
The RTO as a whole failed the three-pivotal supplier test, resulting in market power mitigation being applied to all existing generation capacity resources, resulting in the RTO utilizing the lower of the resources’ market seller offer cap or the submitted offer price when determining the resource’s RPM clearing.
In the 2023/24 BRA, prices in most of the MAAC region dropped nearly 50%, while those in rest-of-RTO fell nearly one-third. (See PJM Capacity Prices Crater.)


