Despite the disruptions of 2022 ― the war in Ukraine, inflation and ongoing supply chain issues ― the U.S. clean energy transition hit new highs in terms of renewable energy and storage deployed, new electric vehicles on the road and new investments, according to the Business Council for Sustainable Energy’s 2023 Sustainable Energy Factbook.
The transition is “now kind of hardwired into the U.S. economy and the way in which we’re evolving,” said Ethan Zindler, head of the Americas for BloombergNEF, which compiled the factbook released Wednesday.
Top line numbers from the annual compendium of energy facts and figures show that renewables, including hydro, accounted for about 23% of U.S. power generation in 2022, up 12.6% from 2021 and, together with nuclear, provided more than 40%, Zindler said during a media briefing Tuesday.
Clean energy drew about $140 billion worth of investment in the U.S., and close to 1 million EVs were sold, both new highs, he said.
Zindler also framed the passage of the Inflation Reduction Act as “absolutely a watershed in terms of policymaking in this sector at the federal level. We’ve really never seen any legislation passed by Congress as ambitious as the [IRA], in terms of what it’s trying to do to set us on the right course towards CO2 reduction and energy transition.”
 With the exception of 2018, renewable energy has been the biggest source of new generation in the U.S. since 2015. | EIA/BloombergNEF
But the scope and speed of the transition must be accelerated if the U.S. is to meet its commitment under the Paris Agreement to reduce its greenhouse gas emissions 50 to 52% below 2005 levels by 2030. Even hitting the interim goal of a 26 to 28% reduction in GHG emissions by 2025 would require annual reductions of 4 to 5% per year, “which would be rather remarkable,” Zindler said.
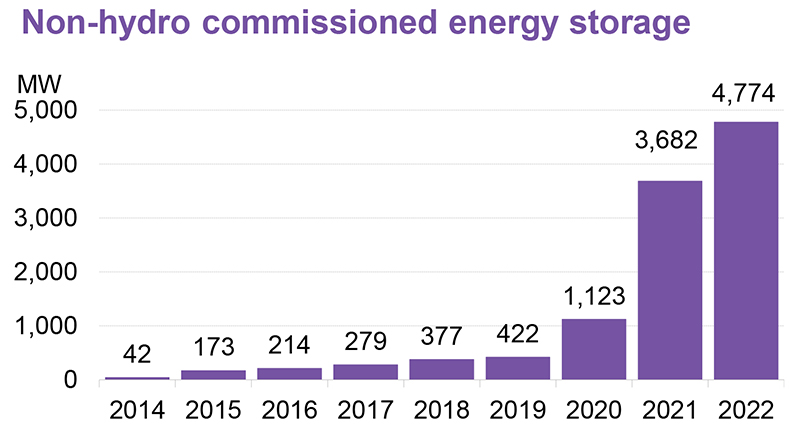
With record growth in 2022, the U.S. continues to be the largest energy storage market in the world. | EIA/FERC/BloombergNEFThus far, the U.S. has cut its emissions 13.8% below 2005 levels, according to the factbook. But last year, emissions from the electric power sector dropped only 1.5%, and emissions from nonpower sectors of the U.S. economy increased 1.9%.
BCSE President Lisa Jacobson argued that it’s too early to predict whether the U.S. will be able to hit its emission-reduction goals, or President Biden’s 2035 target for decarbonizing the U.S. electricity grid. Time will be needed to assess the impacts of recent federal legislation — the IRA, the Infrastructure Investment and Jobs Act, and the CHIPS and Science Act — “not to mention what states and communities and the private sector are doing,” she said.
“We’re trying to lay out what we think would accelerate it even more, but I think we have some pretty strong market signals, and it may take two or three years to really know how much they push us,” Jacobsen said.
Other growth markers in the factbook include:
- As of 2022, corporate procurements of clean energy totaled 19.9 GW. The number of power purchase agreements announced slipped from 118 in 2021 to 112 last year, but the average project size increased from 145 MW to 178 MW. Amazon leads the pack of corporate offtakers, with 8.4 GW of wind and solar.
- Utilities and independent power producers are investing record amounts in transmission: an estimated $31.7 billion in 2022 and $33 billion in 2023, according to figures from the Edison Electric Institute cited in the factbook.
- Energy storage deployments on the grid hit a new high in 2022 of 4.8 GW, which put total storage on the grid at 11.4 GW. Bolstered by tax credits in the IRA, the buildout of a domestic battery supply chain has already attracted $17 billion in investments, primarily focused on the EV sector.
- Driven largely by the growing number of extreme weather events, the number of microgrids coming online has also increased to 101, with the main markets in California, Texas and Florida. Residential storage installations grew 25% year over year in California.
- With funding from the IIJA and IRA, investment in green hydrogen technology is set for major increases. Federal support for green hydrogen could rise to $20 billion by 2030, and as prices fall, the IRA’s $3/kg production tax credit for green hydrogen could completely cover the cost of generation, the factbook says.
Natural Gas on the Rise
The factbook also contains some less optimistic numbers, such as the drop in solar installations last year because of supply chain delays and uncertainty over the Commerce Department investigation of solar imports from Cambodia, Laos, Thailand and Vietnam.
Biden’s two-year moratorium on any tariffs on solar cells or panels from those countries gave the industry some breathing room, but installations still fell from 24 GW in 2021 to 21 GW last year. Similarly, onshore wind deployments fell from 13 GW in 2021 to 11 GW. (See Biden Waives Tariffs on Key Solar Imports for 2 Years.)
At the same time, energy consumption in the U.S. continued its post-pandemic rebound, growing 3% over 2021. Natural gas accounted for 39.4% of U.S. power generation, and natural gas utilities poured more than $35 billion into infrastructure investments in 2021. Overall demand for U.S. natural gas, including exports, rose 5.4%, to a record 95.4 Bcfd.
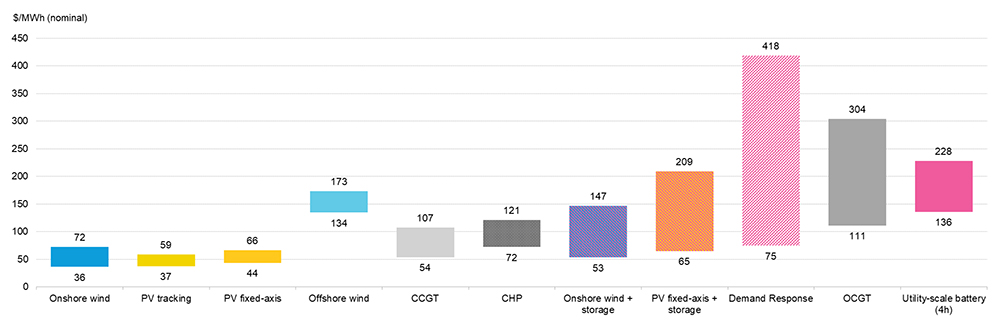 U.S. levelized costs of electricity, unsubsidized for the second half of 2022. Solar and onshore wind remain cheaper than natural gas, but LCOEs for offshore wind and storage are still not competitive. | BloombergNEF
Energy efficiency spending by electric utilities fell during the pandemic, from $6.8 billion in 2019 to a flat $6 billion in 2020 and 2021. Another key factor affecting efficiency is state building codes. More than half of the states in the continental U.S. were using residential energy efficiency building codes from 2009 or earlier.
The International Energy Conservation Code, on which state codes are based, is updated every three years, which means the code has gone through four updates since 2009.
The factbook also looks at the ongoing challenge of interconnection queues, with solar and storage installations leading the projects applying for grid access. PJM and CAISO are called out as the grid operators with the longest wait times, averaging three or more years, versus the shorter two-year or less average for ISO-NE and MISO.
While not specifically called out in the factbook, questions about improving permitting policies and practices were also raised during the media briefing. Jacobson expects GOP bills on permitting to be voted out of the House of Representatives and is hopeful some compromise might be reached.
“We have a lot of proposals on the table, and they’re fairly comprehensive,” she said. “The question is, will the urgency of the need, at least in Congress and the Biden administration, get to the point where they are ready to make a deal. … I think the message is getting across that we will not meet our goals if we don’t take care of streamlining and making it faster and more efficient to build energy projects here in the United States.”