Interconnection queues around the country are filled with over 2,000 GW of new generation, dominated by solar, storage and wind, according to updated analysis from the Lawrence Berkeley National Laboratory released Thursday.
The 2,000 GW number is up 40% from a year earlier, according to LBNL, which studied the seven ISO/RTOs and 35 additional utilities outside organized markets that altogether serve 85% of total electric load in the country. Over 10,000 projects representing 1,350 GW of generation and 680 GW of storage are in the queue.
The zero-carbon generation in the queues alone totals about 1,260 GW, which would be about equal to the total amount of generation operating around the country today.
The growth in projects reflects the real interest in transitioning the industry to a cleaner future, but it also represents growing backlogs as projects take five years to get through the processes, the lead author of the study, Joseph Rand, an energy policy researcher at LBNL, said in an interview.
“The queues illustrate both the opportunity and the challenges of rapid electric sector decarbonization in the United States because we see this unprecedented development interest in new clean energy,” Rand said. “But then, on the other hand, we do see the backlogs and delays and high withdrawal rates.”
Some of the trends in the queue are worthy of concern, but others represent a real opportunity, he added.
The continued growth in the queue reflects the reality that the industry wants to build a lot of renewables, which is because of demand from state mandates and commercial customers, Brattle Group Principal Johannes Pfeifenberger told RTO Insider. But only a fraction of those projects will ever lead to steel in the ground — and the fact that it is so hard to get through the queue contributes to that growth.
“You never know which location on the grid is a good location, or which is a bad location,” Pfeifenberger said. “So, if a developer hopes to develop 1,000 MW of renewables, they might submit 3,000 MW of interconnection requests, hoping to find a good location where it is cost-effective to interconnect.”
While the overall amount of capacity continued to rise in the year, the number of new requests fell from 2021, which LBNL said was caused by both CAISO and PJM pausing new applications as they dealt with significant backlogs that led to new rules in both markets. CAISO’s pause ends this year, but PJM will not take any new requests until 2025.
“The interest in solar, storage and wind is so widespread across the country that even if these two leading markets dip down or pause for a year, it’s surging everywhere,” Rand said.
PJM had the largest number of active projects in its queue at 3,042, followed by the non-ISO West at 1,879, MISO at 1,734, ERCOT at 902, and the Southeast (outside of ISO/RTOs) at 830. By total capacity the numbers are different — with the non-ISO west at 598 GW, MISO at 339 GW, and PJM at 298 GW.
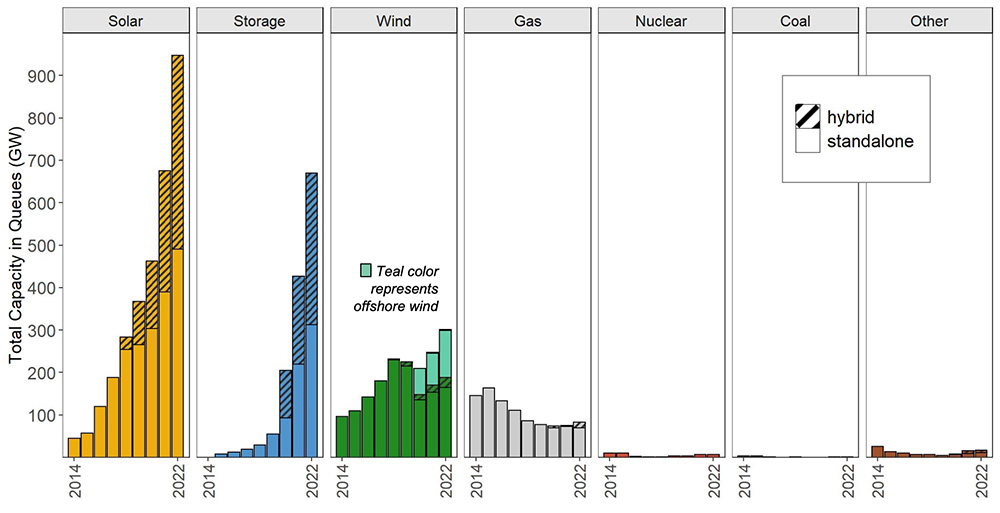 Queue requests by technology type from around the country | Lawrence Berkeley National Laboratory
Solar represents the largest technology by volume in the queue, with 947 GW of the total, followed by storage at 680 GW. Both figures include hybrid projects made up of both technologies.
Solar is widespread across the country, but LBNL noted that both the Northeast and SPP had less of the resource type waiting to connect to the grid. Most of the wind is in the West, or offshore from the East Coast, while storage is centered around the CAISO and the West — although it is rapidly expanding to the east as well.
Offshore wind makes up 113 GW, which is more than enough to meet the Biden administration’s goal of 30 GW by 2030.
Most Projects Drop Out
While the capacity in the queues would be enough to decarbonize the power sector if everything were built, that is not going to happen. For all the projects in queues between 2000 and 2017, just 21% (and 14% of capacity) entered service, LBNL said. The success rate of more recent proposals cannot be determined yet.
More recent projects are dropping out later in the queue process, which exacerbates delays for those left behind as grid operators must do significant restudies to determine who must pay for the transmission upgrades required to reliably interconnect generation.
FERC is working on a couple proposed rules meant to help the process. One would update the pro forma queue rules (RM22-14) to include revisions such as giving priority to projects farther along their development paths, and another on regional planning that would require planners take into account future sources of generation (RM21-17).
FERC’s reforms should help to streamline the queues a little bit, but they are far short of progress in Europe, which is generally farther along in its grid transition, Pfeifenberger said. He said ERCOT has a similar system to that of the United Kingdom and some other European countries, which can move renewables through the queue at a much quicker rate than the current FERC-regulated processes, which were designed over 20 years ago to connect natural gas plants to the grid.
Rand believes that, together, FERC’s NOPRs can have an impact on the queue and its backlog, but they both need to become final rules for that to happen.
“Either one of them in isolation just wouldn’t be sufficient to make a big dent in this problem,” Rand said. “But combined, they might they definitely have real potential to unlock this queue.”
‘Connect and Manage’
The interconnection NOPR would adopt on a national basis changes that some organized markets and individual utilities have already made to speed up their queue and minimize speculative projects, but it will not lead to new transmission being built to resource-rich areas. The transmission planning NOPR would handle that second part, but one key issue remains, Rand said.
“That’s cost allocation: Who pays?” Rand said. “If you’re a generator, trying to interconnect to the grid system, how much do you pay for the interconnection upgrades? And what determines what fraction that you pay? And what types of upgrades you pay for? That’s not really addressed in those two NOPRs, and it’s a very sticky issue that I think leads to a lot of projects ultimately withdrawing from the queue.”
The U.K. and ERCOT both use a process called “connect and manage,” compared with the “invest and connect” process used in FERC-regulated RTOs, and when the British adopted that system their queue times were cut from five years to one year, Pfeifenberger said.
“The idea is you let people interconnect. It might be non-firm, they might get curtailed, but then use … congestion management or proactive transmission planning, where congestion makes it worthwhile to upgrade the transmission system,” Pfeifenberger said.
Enel North America, a subsidiary of the Italian utility that develops renewables and is a major player in demand response, has written a whitepaper endorsing the basics of connect and manage, and it has made similar arguments to FERC as it weighs reforms, he added.
ERCOT does not have the regular, proactive transmission planning process to compliment the “connect and manage” process, Pfeifenberger said. The process has not been adopted elsewhere in the U.S. because it represents a major change from the normal of doing business.
“It’s very hard for an ISO to change it in the connection process,” Pfeifenberger said. “First of all, the ISO may not want to because they think the interconnection process is what is necessary. But even if they wanted to, they have to go through the stakeholder processes; they have to change the tariff; they have to get FERC approval. But I think it’s mostly a mindset issue, that the ISOs just like the way they’re doing it.”
ERCOT does have a record of more quickly connecting resources to the grid, but Rand said it was not a silver bullet because projects there face higher risks of curtailment as the Texas grid operator just offers energy-only service as opposed to the network interconnection service in other markets.
“You can connect without paying those upfront, interconnection upgrade costs,” Rand said. “But you face a curtailment risk. You face a lot more curtailment risk, perhaps, than you might get in MISO if you have a network interconnection service.”