The independent safety monitor that keeps watch on Pacific Gas and Electric said much of the utility’s distribution system is “stressed” with age and needs to be replaced for reliability and to avoid wildfires, but that the utility has greatly reduced the number of fires its equipment starts by quickly de-energizing lines when faults occur.
The findings were part of a 38-page report drafted by Filsinger Energy Partners and released Tuesday by the California Public Utilities Commission, which hired Filsinger last year to monitor PG&E’s safety work and report back every six months. (See CPUC Orders Independent Safety Monitor for PG&E.)
Filsinger, a Denver-based advising firm, filed its first report Oct. 4. (See PG&E Slow to Replace Old Equipment, Monitor Says.)
Its second report, dated April 3 but made public May 2, covers PG&E’s activities from October to March.
During that time, the independent safety monitor (ISM) “participated in meetings where several PG&E managers reported that a shift in strategy is required as the PG&E distribution asset base ages more towards its end of life, and that elevated investment levels will be required to adequately control and mitigate the associated risks,” the report says.
PG&E’s 70,000-square-mile overhead distribution system includes 161,500 miles of power lines, 2.25 million wooden poles and more than 669,000 transformers, the report notes.
Much of the system serves high-risk fire areas, where PG&E equipment started major wildfires each year from 2017-2021.
Parts of the utility’s vast distribution system “are currently stressed or are forecast to become stressed,” and a third of its overhead conductor qualifies for “asset health replacement in the next 10 years,” the report says.
“While half of the distribution circuits have good reliability, approximately 20% of the circuits are responsible for 50% of the average customer outage duration across the distribution system,” it says. “There is a considerable backlog of distribution asset maintenance and/or upgrade items needing to be addressed, including approximately 120,000 poles tagged for replacement.”
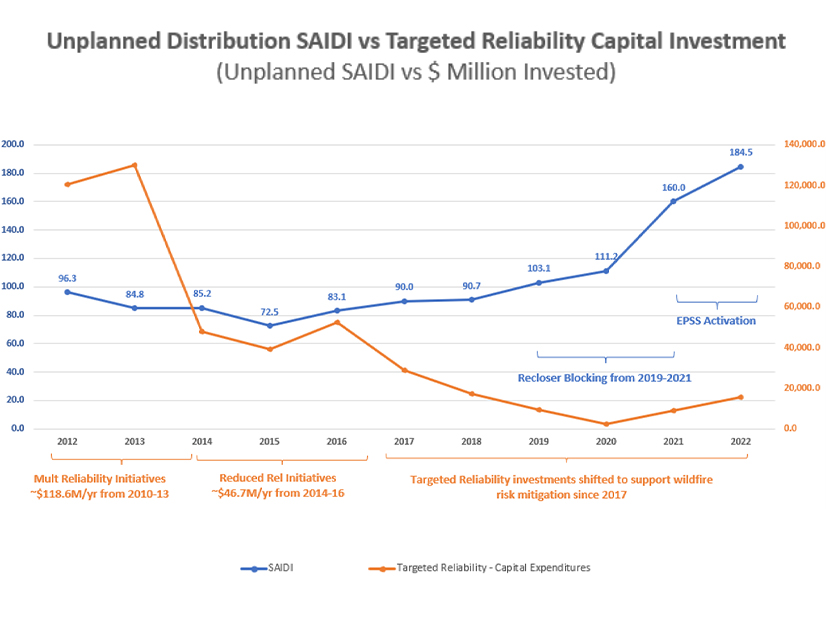
PG&E’s annual spending on reliability-oriented projects plunged from more than $180 million in 2013 to less than $5 million in 2020, in part because of spending on wildfire mitigation since 2017, it says.
From 2015 to 2020, PG&E’s System Average Interruption Duration Index (SAIDI), a measure of the duration of unplanned outages, increased by 53% while reliability spending fell, the report says.
The outage index rose when PG&E began using public safety power shutoffs (PSPS) in 2018 and when its Enhanced Powerline Safety Settings (EPSS) program took effect in 2021, it says. EPSS increases the fault detection sensitivity on power lines and quickly de-energizes them when it senses a change in current.
“During the current ISM reporting period, the ISM observed that PG&E’s unplanned distribution SAIDI increased by an additional 66% since 2020, and PG&E sits in the fourth quartile for SAIDI as compared to all other U.S. based electric utilities,” the report says.
Maintenance Backlog
PSPS and EPSS have angered many residents and endangered those who rely on plug-in medical equipment, but they have been effective at reducing ignitions by PG&E equipment.
The report says that, since 2017, the number of ignitions in high fire-threat districts “attributed to PG&E equipment failure has been in steady decline.” There were 59 ignitions in 2017 and 14 in 2022 — a 76% decrease, it says.
“The largest contributing factor for this decrease in the last two years has been the introduction of EPSS enablement across all of PG&E’s HTFD [high fire-threat district] distribution circuits in 2022,” it says.
PG&E believes that “wire down rate is a key indicator of public safety,” the report says, quoting the utility. “Wire downs per year have stayed steady over the past five years. However, [PG&E expects] the number of wire downs to increase as conductors are aging faster than the replacement rate.”
PG&E, which has been criticized for its lack of record keeping, has age data on only 47% of its primary conductors and 12% of its secondary conductors, the report says.
Using an alternative methodology, PG&E determined that it should replace approximately 800 miles of overhead conductor per year, but “over the past seven years, the miles of proactive replacement of deteriorated conductor have averaged approximately 40 miles per year,” the report says.
PG&E said in a statement Wednesday that it “has made significant progress in the areas of safety and risk reduction, including in the focus areas identified by the ISM team,” but that its wildfire mitigation efforts have created a maintenance backlog.
“Our increased inspections, which exceed CPUC General Order requirements and better address wildfire risk, created a build-up of repair work,” the utility said. “In our 2023 Wildfire Mitigation Plan, we committed to providing targets for addressing repairs found during inspections [and] prioritizing work with the most ignition risk within the high fire threat districts.”
The utility said it has refocused its efforts on “addressing … asset replacement, including developing strategies for managing wear-out failures.”
