The U.S. solar market saw a 32% drop in new utility-scale megawatts installed across the country in 2022, but it could be heading for a record rebound this year, according to a new report from the Lawrence Berkeley National Laboratory (LBNL).
In the first seven months of 2023, utility-scale solar capacity was up 50% over the same period in 2022, with estimates of total installations hitting 24 GWAC, based on estimates from the Energy Information Administration, the report says.
The report defines “utility-scale” as grid-tied, ground-mounted projects of 5 MWAC or more. In 2022, total installations provided only 12 GWDC of new generation, the report says, citing figures from industry analyst Wood Mackenzie.
Even with the decline, utility-scale solar added the most new megawatts to the U.S. grid, accounting for 27% of new generation versus 22% each for wind and residential rooftop solar.
Those figures reflect the combined impact of evolving technologies and federal and state policies on the utility-scale market.
For example, the report attributes 2022’s decline to the double-whammy of U.S. solar tariffs — which President Joe Biden put on hold for two years in June 2022 — and a slowdown in imports due to the Uyghur Forced Labor Prevention Act (H.R. 6256), passed in December 2021.
The law bans imports from China’s Xinjiang province, where reports had surfaced of minority Uyghurs being used as forced labor. The province provides about 50% of all the world’s polysilicon, a key component of solar panels. Initial implementation of the law resulted in U.S. Customs and Border Protection holding thousands of shipments of solar panels, according to a Reuters report.
Release of the backlog began in March of this year, following a clarification of the rules, according to a subsequent Reuters report.
Looking ahead, the report sees additional market tailwinds, with PPA prices possibly falling as developers take advantage of either the investment tax credit (ITC) or production tax credit (PTC) in the Inflation Reduction Act (IRA). Solar projects previously were limited to the ITC, which the IRA reset at 30%, but the law also makes the PTC available, which in some instances may pencil out better, the report says.
Also, more than half of new utility-scale projects added to the grid through July 2023 are sited in what the IRA defines as “energy communities” eligible for 10% additions to the ITC or PTC. Energy communities, broadly defined, are areas that have been dependent on fossil fuel production and have lost jobs and tax revenue as a result of plant closures.
![]()
Other trends detailed in the report include:
-
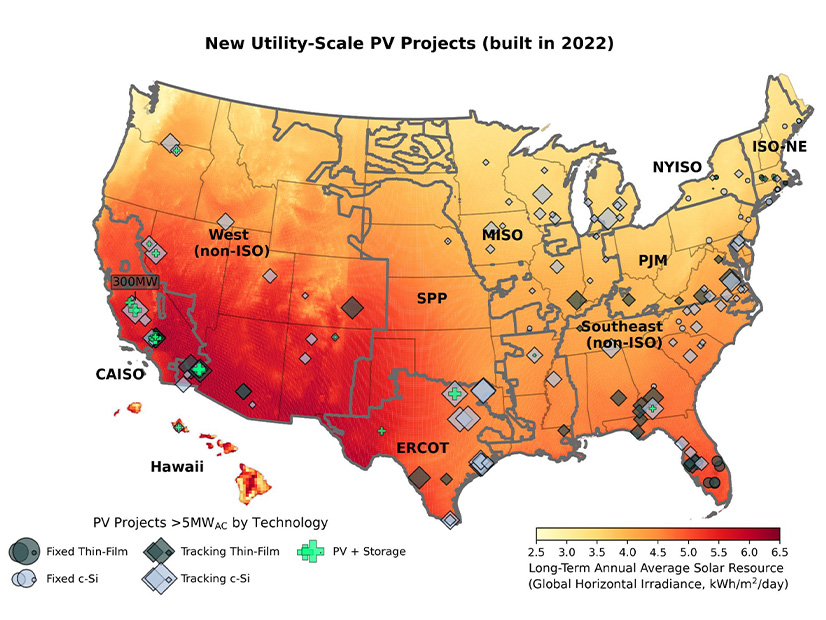
- Almost all new utility-scale projects — 94% — added to the grid in 2022 were installed with single-axis trackers, which adjust panel position to follow the sun to increase solar output. Fixed-tilt projects are increasingly limited to sites with rugged or uneven terrain, such as landfills or brownfields, or with high winds.
- Texas and California continued to lead the nation on new utility-scale solar in 2022, adding 2.4 GWAC and 2.1 GWAC respectively.
- But the two states also led the nation in overproduction resulting in project curtailments. In Texas, ERCOT reported 2,797 GWh of solar curtailed in 2022, while CAISO curtailed 2,057 GWh.
- Hybrid projects with solar and storage are steadily increasing. A record 26 new hybrid plants, totaling 2.2 GWAC were added to the grid last year, but the average duration of storage on these projects fell, from 3.2 hours in 2021 to 2.7 hours in 2022.
- Power purchase agreements (PPAs) for utility-scale solar now average $25/MWh, up slightly from a 2019 low of $22/MWh but still competitive with wind and natural gas.
Interconnection And Value
President Joe Biden has set an aggressive target for the U.S. to decarbonize its electric power grid — and run completely on zero-emission energy — by 2035, while cutting emissions economywide 50% to 52% by 2030.
A growing number of reports and analyses are estimating that reaching these goals will require a dramatic ramp-up in solar generation. Released Wednesday, a report from industry consultants ICF sees solar going from 3% of the U.S. energy mix in 2022 to 16% in 2030 and 65% by 2050. The International Energy Agency’s recently updated road map to net zero by 2050 calls for a fourfold increase in solar and wind deployments worldwide.
Based on Wood McKenzie’s numbers, the LBNL sees new utility solar capacity increasing more than fourfold from 12 GW in 2022 to over 50 GW per year.
But here again, getting there will depend on a combination of economic and technical factors, first and foremost how quickly utilities and grid operators can upgrade their systems and processes to speed up interconnection.
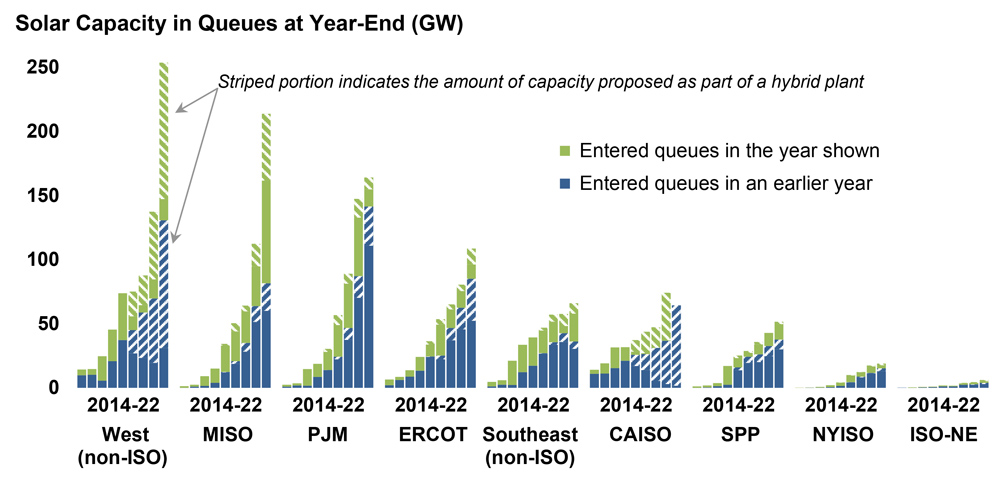
The interconnection queues across the U.S. remain jammed with a total of 947 GW of solar, including 351 GW that were added to queues in 2022, according to LBNL. Hybrid solar and storage projects make up 457 GW of the total, the report says.
Western non-RTO queues are largest, with about 250 GW, followed by MISO (more than 200 GW) and PJM (more than 150 GW), according to the report.
Another factor will be the impact of tariffs on solar panels imported from Cambodia, Malaysia, Thailand and Vietnam, which are scheduled to go back into effect when Biden’s moratorium ends in June 2024. While the IRA has triggered a growing number of announcements of new solar cell and panel plants in the U.S., Abigail Ross Hopper, CEO of the Solar Energy Industries Association, has said it could take three to five years to stand up a complete U.S. supply chain. (See Commerce Dept. to Reimpose Tariffs on SE Asian Solar Manufacturers.)
A possible counterbalance to any future tariffs, solar’s value to the grid is rising, compared to PPA prices, the report says. The market value of solar varies across different RTO and ISO service regions, ranging from $51/MWh in CAISO to $85/MWh in PJM and up to $108/MWh in some non-RTO areas of the Southeast.
“Since 2020, rising wholesale energy prices more than compensated for moderate PPA price increases, making solar more competitive than it has ever been across the nation,” the report says.