WECC does not want its analysis of the August heat wave that caused rolling blackouts in California and high-level grid emergencies in other Western states to be a “one-and-done” affair.
“Given the nature and complexity of the heat wave event, we didn’t think it appropriate to create just one report,” Vic Howell, WECC director of reliability risk management, said during a stakeholder call Wednesday.
Instead, the regional entity for the Western Interconnection is developing an information website that it can update as it uncovers more findings about the Aug. 14-18 weather event that prompted CAISO to shut off power to about 2.4 million California residents and provoked 30 energy emergency alerts (EEAs) across 10 balancing authority areas, including nine that escalated to EEA 3 — the highest level — according to RC West. (See Western BAs Lauded for Coordination During Western Heat Wave.)
Howell said WECC staff are still determining how to break down the website’s design into “buckets of topics.” He noted that the RE could not cover every issue related to the heat wave because of the complexity of the event.
WECC’s work is meant to supplement the analysis that CAISO, the California Public Utilities Commission and the state’s Energy Commission are performing to identify the root causes for the blackouts, Howell said. Those agencies jointly issued their preliminary report last month. (See CAISO Says Constrained Tx Contributed to Blackouts.)
Howell re-emphasized that WECC is broadening the scope of its analysis to include examination of developments across the entire interconnection. (See WECC Examining August Heat Wave with West-wide Lens.)
The objective is to identify the underlying issues behind the EEAs and provide corrective recommendations, according to Tim Reynolds, senior engineer at WECC.
“This isn’t a one-and-done. … We want to continue to go through this … and have that learning mentality so we can grow as an interconnection,” Reynolds said.
WECC’s analysis has produced four preliminary findings — “still subject to change,” Reynolds said — related to the cause of the emergencies, including: high demand for generation, transmission congestion, inaccurate forecasts and resource adequacy issues. The findings align with the California joint agency root-cause report.
During the heat wave, the Western Interconnection hit an all-time demand peak of 162,017 MW on Aug. 18, coming in well under the forecast peak of just under 167,000 MW because of conservation measures, Reynolds said. The system peak occurred about two weeks later than WECC had forecast and resulted in high levels of north-to-south energy transfers. At the same time, planned outages on north-to-south transmission lines created limitations that caused congestion on those paths.
“On normal days these outages may not have caused any issues, but as we just hit a peak load from the interconnection during this heat wave, there was some congestion that was happening,” Reynolds said.
He pointed out that a number of balancing authorities reported to WECC that inaccurate variable generation forecasts had forced them into EEAs. Some BAs also fell short in their demand forecasts.
Coping with Variability
Matt Elkins, WECC manager of performance analysis and resource adequacy, used the RE’s Maverik tool to walk stakeholders through the RE’s approach to examining resource adequacy shortfalls during the heat wave. “Are we forecasting the variability of the system accurately, so that we can really get ahead of these events and not be surprised by them?” he said.
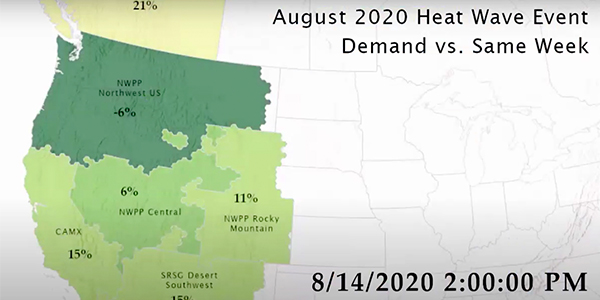
To assess the accuracy of WECC’s summer peak forecast, Elkins’ group used geospatial maps to compare regional hourly demand data from the week of the heat wave against figures for the same week a year earlier.
Elkins noted that CAISO found the August heat wave especially challenging because nighttime temperatures “didn’t get low enough” to temper demand. For example, WECC’s “same week” comparison showed that during the 12 a.m. PT interval Aug. 16, demand in WECC’s CAMX (California and Baja California Norte, Mexico) region was 41% above the 2019 figure, with the Northwest Power Pool (NWPP) Central and Southwest Reserve Sharing Group (SRSG) Desert Southwest regions at 44% and 29%, respectively, above the previous year. At the same time, demand in NWPP’s Northwest region was just 4% above that of the same week in 2019, while NWPP Canada (British Columbia) exceeded the previous year’s figure by a surprising 35%.
WECC also performed an analysis comparing heat wave load figures for its originally forecasted “peak week” — predicted to occur in late July — with those from its year-ahead 50/50 forecast. That exercise showed similar deviations between expectations and actuals.
Because the heat wave persisted for multiple days and was spread across such a wide region, WECC additionally compared demand from each of the Aug. 17-19 weekdays with its peak day forecast. This “repeated highest peak weekday” exercise showed lower, but still significant, variability between actuals and the peak forecast, with CAMX 21% higher during the 2 a.m. PT interval, the Northwest U.S. about 1% lower and the Desert Southwest in line with predictions. British Columbia came in about 40% above the forecast.

“I think one of the things we want to look at to really be sure our forecasts our correct is that we’re picking up Canada’s shape correctly. I don’t know if they’ve had a lot of air conditioning growth, so we definitely want to check that out,” Elkins said.
Elkins’ presentation showed that each exercise revealed that deviations from expectations persisted throughout the day over the heat wave. He speculated that the COVID-19 pandemic might have contributed to unexpectedly high load during the daytime, with residential demand boosted by people working at home, but he acknowledged WECC is still trying to gain insight into what drove the variability from forecasts.
WECC also examined how renewable performance during the heat wave stacked up against its 50/50 generation forecasts. “In this one … the numbers are going to be negative. That means it’s less than we expected, which is not a good thing,” Elkins said.
The analysis picked up significant underperformance of renewable resources. For example, renewable output in the CAMX area was 24% below forecast at 1 p.m. PT on Aug. 14. The following day saw intervals when Desert Southwest renewables underperformed forecasts by 20%.
Elkins said that while he “feels good” that WECC’s forecasts are reflecting the general variability in renewable generation, the next step is to “take a look and say what is the [forecasting] model telling us our reserve margins should’ve been to cover that amount of variability and then start looking at how much reserves were there in the system” during the heat wave.
The findings will be the subject of the technical session at WECC’s next quarterly Board of Directors meeting Dec. 8.